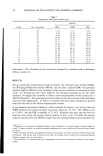
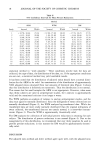
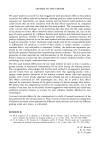
16 JOURNAL OF THE SOCIETY OF COSMETIC CHEMISTS Table I Estimates of Mean Percent Reductions Method Study No. of panelists ARM WFM DM 1 29 - 1.16 3.21 -3.67 2 30 9.65 14.59 8.81 3 30 19.49 20.60 18.04 4 30 19.98 19.54 15.95 5 10 22.72 21.72 19.16 6 30 22.77 21.77 18.34 7 52 27.68 29.65 26.64 8 29 32.96 35.51 32.24 9 30 41.96 48.70 44.30 10 30 42.05 42.93 38.92 11 30 43.56 45.72 42.65 12 33 45.28 47.13 43.99 13 32 50.30 55.42 53.31 14 15 56.55 58.10 54.17 15 15 59.92 65.96 62.49 ß 1 reducuons . The calculation of this interval is obtained by a method used in deodorant efficacy studies (6). RESULTS For any particular antiperspirant study of interest, the adjusted ratio method (ARM), the Wooding-Finkelstein method (WFM), and the direct method (DM) will generally produce slightly different point estimates of the percent reduction in sweating for that study. To demonstrate how much different the estimates typically are for the three methods, we applied the methods to fifteen recent antiperspirant studies conducted at Hill Top Research 2. The posttreatment data analyzed were the one-hour collection taken after the third application 3. In Table I we present the three point estimates of percent reduction for each of the fifteen antiperspirant studies. If you examine the results of Study 8, which included 29 subjects, you will see that the WFM produced the largest estimate of percent reduction, 35.51%. The ARM is next at 32.96%, and the DM is smallest at 32.24%. Although this exact pattern does not exist for every study, the overall trend is similar. In fact, in all 15 studies the percent reduction produced by the WFM is larger than the corresponding estimate produced by t Depending on the number of subjects sampled, either a Student's t or a large sample Z interval might be found. To assure validity, we would recommend sampling over thirty subjects and using the large sample procedure. 2 When selecting the fifteen antiperspirant studies to be analyzed, we made sure they covered a wide range of efficacies. This was the only criterion used to select the studies, and no studies were eliminated because of lack of support for our conclusions. 3 This collection is accepted as one that is appropriate to use when estimating the efficacy of an antiper- spirant.

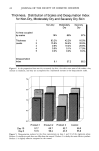
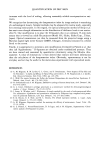
ANTIPERSPIRANT DATA ANALYSIS 17 the DM. The average of the estimates of percent reduction using the WFM are 3.68 larger than the average of the estimates using the DM. In 12 of the 15 studies, the percent reduction produced by the ARM is larger than the corresponding estimate produced by the DM. The ARM produced estimates that averaged 1.22 more than those produced by the DM. There are theoretical reasons that explain the differences in the estimates shown by these empirical results. A basic statistical result is that the arithmetic mean of a sample is an unbiased estima- tor 4. Since the DM uses the mean of the sample of percent reductions in sweating as an estimator, this method will provide an unbiased estimator, one that tends (on the average) to be neither larger nor smaller than the true efficacy of the antiperspirant being tested. It can be mathematically shown that for any given antiperspirant study, the estimated percent reduction produced by the WFM will always be larger than the corresponding estimate produced by the DM 5. Thus the WFM will tend to overestimate the efficacy of an antiperspirant. The estimate produced by the ARM uses the average of ratios. It is for this reason that in Table I the estimates for percent reduction for the ARM tend to be slightly larger than those produced by the DM 6. When comparing estimators, an unbiased estimator is generally preferred to one that is biased. For this reason, the DM is preferable to both the ARM and the WFM. A second point that is often considered when comparing methods of estimation is the variability associated with the estimators 7. This can be thought of as a measure of precision, and may be assessed by examining the widths of the confidence intervals estimates. In Table II we present 95% confidence intervals calculated by the WFM, ARM, and DM for the fifteen antiperspirant studies introduced in Table I. The average width of the ARM confidence intervals is 2.52 less than the average width of the DM confidence intervals. Thus it appears that the ARM estimates are less variable than the DM estimates, and for the same sample sizes, this tends to be true. However, baseline measurements must be collected to obtain the ARM estimates, while this is not necessary for the DM to be used. If baseline measurements were not collected, these resources could be used to collect more posttreatment measurements. Thus, for similar expenditures, the ARM and DM would produce confidence intervals of comparable widths. The average width of the WFM intervals is 0.22 less than the average width of the DM intervals. These empirical results suggest there is little difference in the variability of the two estimators. Finally, for any statistical procedure to be used, it should be statistically valid. By the validity of the procedure we mean certain conditions (assumptions) must be met for any 4 In this context, an unbiased estimator will on the average be equal to the value it is estimating. 5 This is due to the relationship between the geometric mean (calculated for the WFM) and the arithmetic mean (calculated for the DM). 6 When the sample average ratio of two variables is used to estimate the ratio of the true averages of the two variables, the estimate is generally not unbiased. 7 A comparison of the variability of different estimators is of most interest when comparing different unbiased estimators.
Purchased for the exclusive use of nofirst nolast (unknown)
From: SCC Media Library & Resource Center (library.scconline.org)