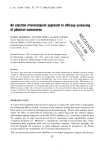
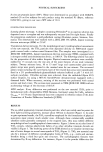
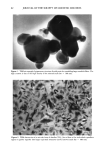
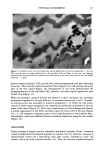
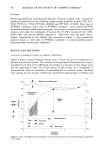
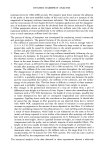
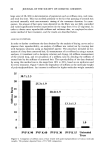
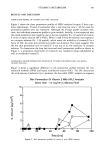
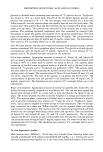
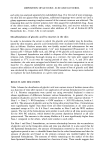
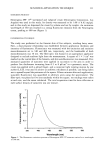
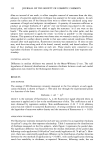
VITAMIN E METABOLISM 89 RESULTS AND DISCUSSION PERMEATION PROFILE OF VITAMIN E BY HPLC ANALYSIS Figure 3 shows the three permeation profiles of HPLC-analyzed vitamin E from trip- licate experiments. Vitamin E permeated after a very long lag time (--48 hr), and the permeation profiles were not consistent. Although the average profile increases with time, the individual permeation profile is quite variable. Initially, it was suspected that this small permeation rate might be due to the low solubility (Cs: 18 mg/ml) of vitamin E in the receptor solution (40 % PEG). When 5 mM Tween-80 solution was employed as a receptor solution (Cs: 2.26 mg/ml), which raised the solubility of vitamin E by a factor of 100, the same skin permeation profile was obtained. This result suggests that the low skin permeation rate of vitamin E is not due to its low solubility in receptor solution. To characterize the long lag times and small permeation profiles as shown in Figure 3, a permeation experiment of vitamin E was conducted using radiolabeled as well as nonlabeled vitamin E. COMPARISON OF SKIN PERMEATION PROFILES OF VITAMIN E BETWEEN HPLC AND RADIO TRACER ANALYSIS Figure 4 shows a significant difference in the permeation profiles between the two analytical methods, HPLC and liquid scintillation counter (LSC). The LSC determines the total amount of radioactivity to permeate the skin while HPLC analysis can separate Skin Permeation Of Vitamin E With HPLC Analysis Donor Soln ß 13 mg/ml in Silicone Fluid 10 6 i / / -'O o 0 20 40 60 80 1 o0 Time (hrs) Figure 3. Skin permeation profiles of vitamin E with HPLC analysis.

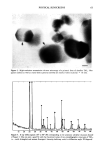
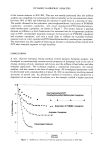
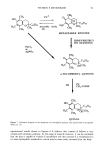
90 JOURNAL OF THE SOCIETY OF COSMETIC CHEMISTS lOO Skin Permeation Of Vitamin E Donor solution ß 13mg/ml in S.F. c: o E 80 60 40 20 0--0' HPLC Analysis ••: Radio Analysis oo /1 20 40 60 o : 0 o 80 1 oo Time (hrs) Figure 4. Comparison of skin permeation of vitamin E using HPLC with radioanalysis. vitamin E from other metabolites. The radiolabeled vitamin E promptly penetrated the skin, while nonlabeled vitamin E appeared after a remarkably long time lag (--48 hr). If the long time lag observed in HPLC analysis is caused by skin binding, since the binding also increases lag time (12), the permeation profile of radiolabeled vitamin E should be similar to that from HPLC analysis. This is not the case in Figure 4. It is therefore suggested that the long time lag may be due to significant metabolism of vitamin E during the initial period of time, when the enzyme responsible for vitamin E metabolism is still very active. During the initial period of time, most vitamin E in the skin may be metabolized. When the time elapses, however, the enzymes are deac- tivated gradually and intact vitamin E appears. IDENTIFICATION OF VITAMIN E AND ITS METABOLITES DURING SKIN PERMEATION Figure 5a shows the HPLC chromatogram of ot-tocopherol, ot-tocopherol quinone. Figure 5b shows the chromatogram of tritium-labeled ot-tocopherol. In Figure 5a, the upper panel of the chromatogram is an HPLC analysis of standard ot-tocopherol (a-T) and its primary metabolite, ot-tocopherol quinone (ot-TQ) with a UV detector at 280 nm. ot-Tocopherol and ot-tocopherol quinone show retention times at 13 minutes and 10 minutes, respectively. The peak at one minute is that for a solvent, methanol. In Figure 5b, the lower panel of the chromatogram is a purity test of radiolabeled ot-to- copherol using HPLC in line with a liquid scintillation counter. As the mobile phase flowed through the HPLC system, tritium-labeled ot-tocopherol was separated as a function of retention time. Most of the radioactivity of radiolabeled vitamin E was
Purchased for the exclusive use of nofirst nolast (unknown)
From: SCC Media Library & Resource Center (library.scconline.org)