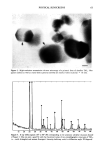
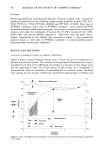
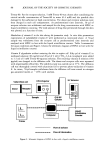
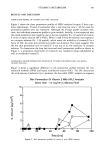
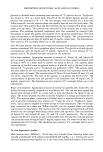
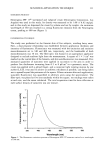
SUNCREEN APPLICATION TECHNIQUE 111 SUNSCREEN PRODUCT Neutrogena SPF 15 © waterproof and rubproof cream (Neutrogena Corporation, Los Angeles) was used in this study. Its density was measured to be 1.08 __ 0.02 mg/txl, and in this study we dispensed the cream by volume and not by weight. An excitation wavelength of 340 nm resulted in a strong fluorescent emission from the Neutrogena cream, peaking at 400 nm (Figure 1). EXPERIMENTAL TECHNIQUE The study was performed on the forearm skin of five subjects, avoiding hairy areas. First, a dose-response relationship was established between application thickness and intensity of fluorescence. Fluorescence was measured with the excitation and emission monochromators set to 340 and 400 nm, respectively, and the bandwidth of both monochromators was 10 nm. The fiber-optic was housed in an appropriate applicator designed to exclude ambient light from the measurement. A square of 5 x 5 cm 2 was marked on the ventral skin of the forearm, and skin auto fluorescence was measured. Five measured quantities of sunscreen were applied in succession to the area in order to produce five thicknesses increasing from 0.5 to 8 txl/cm 2 in a geometric series. The cream was applied with a gloved finger, and a consistent light rotating motion by one author (L. E. R.) was used to achieve as uniform a thickness as possible, care being taken not to spread beyond the perimeter of the square. Fifteen minutes after each application, sunscreen fluorescence was quantified in arbitrary units using the spectrometer. The fiber-optic was placed at five sites randomly within the square, ten readings were taken at each site, and the mean calculated. The total acquisition time for data collection at each surface density of sunscreen was one minute. 0.8 0.6 0.4 0.2 * I ' I I I I •50 400 450 500 550 600 Wavelength (nm) Figure 1. The fluorescence emission spectrum of Neutrogena SPF 15 © sunscreen excited at a wavelength of 340 nm.

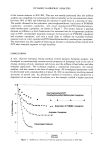
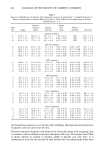
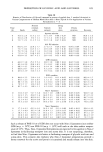
112 JOURNAL OF THE SOCIETY OF COSMETIC CHEMISTS After an interval of one week, to allow complete removal of sunscreen from the skin, adequacy of sunscreen application technique was assessed in the same subjects. In each person the surface area of the forearm from wrist to elbow was calculated using mea- surements of length and midpoint circumference. A quantity of sunscreen sufficient to produce an average thickness of 1 •I/cm 2 over one forearm was placed in the contra- lateral palm, and subjects were asked to apply the sunscreen "as if you were on the beach." The same quantity of sunscreen was then placed in the other palm, and the subjects were instructed to apply the cream "as evenly as possible" to the remaining forearm. This quantity of sunscreen was chosen since we wanted to study its distribution when applied at a surface density similar to that seen under natural conditions. Fifteen minutes after each application, fluorescence intensity was measured at 16 sites on each arm, with four sites along each of the dorsal, ventral, medial, and lateral surfaces. The mean of four readings was taken at each site. These results were converted to an equivalent thickness of sunscreen using the previously determined dose-response rela- tionship. STATISTICAL ANALYSIS Difference in median thickness was assessed by the Mann-Whitney U test. The null hypothesis of identical distributions of sunscreen thickness between crude and careful application was tested by the Kolmogorov-Smirnov test. RESULTS DOSE-RESPONSE The average (-+SD) fluorescence intensity measured in the five subjects at each appli- cation thickness is shown in Figure 2. The solid line through the experimental points is a function of the form: thickness = a(I - Io) b where I is the intensity of fluorescence. I o is the fluorescence signal obtained when no sunscreen is applied and is due to the auto fluorescence of skin. The coefficients a and b were obtained by regression analysis. Skin autofluorescence (1.44 -+ 0.43 arbitrary units) was low relative to sunscreen fluorescence. A strong correlation was seen between the logarithm of sunscreen surface density and the intensity of fluorescence (r = 0.99). APPLICATION TECHNIQUE The fluorescence intensity measured at each site was converted to an equivalent thickness (in •l/cm 2) using the dose-response relationship. Table I summarizes the distributions of thickness measured on the five subjects, while Figure 3 represents the pooled data. No significant difference was found between the median thicknesses of the pooled data following crude application (0.68 }xl/cm 2) and careful application (0.76 }xl/cm2). How- ever, there was a statistically significant difference in the distribution of surface densities between the two methods of application (p 0.007), with careful application showing much less variability in thickness, as expected. Moreover, following crude, but not
Purchased for the exclusive use of nofirst nolast (unknown)
From: SCC Media Library & Resource Center (library.scconline.org)