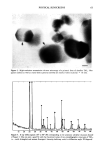
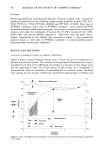
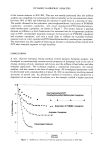
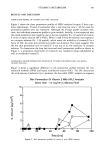
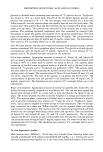
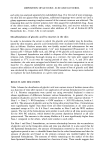
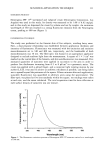
SUNCREEN APPLICATION TECHNIQUE 113 2O 15 10 r = 0.99 I I I I , , , [ [ I I ' I [ I I I [ 0.1 1 10 Sunscreen density (pl/cm 2) Figure 2. Dose-response relationship between surface density of Neutrogena SPF 15 © on the skin (}xl/cm 2) and intensity of fluorescence (arbitrary units) obtained from five subjects. Table I Summary Statistics on Thickness (}xl/cm 2) of Neutrogena SPF 15 © With Careful and Crude Application Subject I Subject 2 Subject 3 Subject 4 Subject 5 Careful Crude Careful Crude Careful Crude Careful Crude Careful Crude Median 0.63 0.97 0.57 0.56 1.19 0.16 0.86 0.64 0.92 0.71 Inter-quartile range 0.58 1.52 0.19 1.19 0.98 0.93 0.41 1.13 0.46 0.89 Full range 1.19 4.65 0.58 3.00 1.53 4.60 1.16 3.22 1.90 3.46 careful, application, most subjects were shown to have some sites where no sunscreen had been applied. DISCUSSION We have shown that the surface density of a sunscreen can be determined by quantifi- cation of product fluorescence on the skin. The method is simple, rapid, and com- pletely noninvasive, and could have a wide range of applications. The Neutrogena SPF 15 © cream was chosen because of its strong autofluorescence, but other products with weaker or no intrinsic fluorescence could also be tested following addition of a fluores- cent substance. Uniformity of sunscreen surface density on the skin was seen to be heavily influenced by application technique. Sayre et al. (16) reported that rubbing a sunscreen into the skin reduced the SPF, but they did not determine the product thickness. Whereas previous

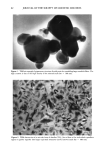
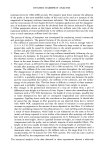
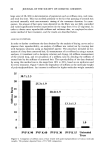
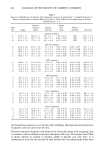
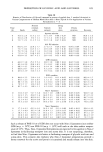
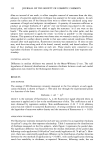
114 JOURNAL OF THE SOCIETY OF COSMETIC CHEMISTS i i i crude careful Sunscreen application technique Figure 3. Distribution of surface density of Neutrogena SPF 15 © (•xl/cm 2) on the forearm following crude and careful application techniques in five subjects circles represent median values, hatched areas are the interquartile ranges, and lines show the full ranges. reduced the SPF, but they did not determine the product thickness. Whereas previous investigators have shown that the gross average thickness applied is far less than 2 mg/cm 2 (5-8), our study reveals the pronounced variation that may occur within a relatively small anatomical region. Consequently, the sun protection factor achieved by a sunscreen will be much lower than expected on some areas of the skin. That sunscreen use has been reported to be a risk factor in melanoma (17,18) might be explained on the basis of underprotection due to careless application coupled with overexposure to the sun. In addition, models for reduction of risk of non-melanoma skin cancer with regular sunscreen use (19) will overestimate the benefit. Hence, it is important that sunscreen users are advised of the importance of careful application to achieve uniform, adequate protection. The efficacy of new sunscreens is assessed by standardized clinical phototesting, which is invasive, time-consuming, and expensive. A number of in vitro tests have been developed that attempt to predict the SPF by measuring the transmission characteristics of the product on a variety of substrates. However, none of these are ideal. It has been shown (20) that the applied thickness of sunscreen in vivo, at 0.5, 1, and 2 mg/cm 2, correlates with the SPF, and we have now demonstrated that for a given sunscreen, the surface density correlates with fluorescence intensity. Hence, fluorescence spectroscopy potentially could provide a surrogate clinical method for estimating the SPF of new sunscreens. While some in vivo phototesting will continue to be necessary in product evaluation, measurement of fluorescent emission could provide a convenient and rapid method for SPF assessment in complex clinical tests such as those for substantivity, e.g., sweat and water resistance.
Purchased for the exclusive use of nofirst nolast (unknown)
From: SCC Media Library & Resource Center (library.scconline.org)