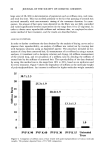
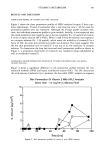
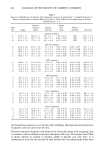
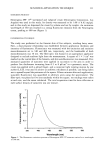
102 JOURNAL OF THE SOCIETY OF COSMETIC CHEMISTS Table I Kinetics of Distribution of Glycolic Acid (expressed as percent of applied dose + standard deviation) in Various Compartments of Hairless Mouse Skin After l-Hour Topical In Vivo Application of Various Formulations (n = 3) Stratum Living Time corneum Stratum skin Urinary (h) Swabs surface corneum strata excretion Recovery Aqueous solution 0 40.0 + 3.7 28.4 -+ 1.7 16. l -+ 3.7 1.04 -+ 0.14 ND 85.7 -+ 2.2 4 55.9 + 9.1 19.9 + 5.5 11.8 + 2.1 0.96 + 0.18 ND 88.5 + 3.8 8 40.1 + 7.9 17.0 + 1. l 16.3 + 0.9 0.32 + 0.01 ND 73.7 + 5.6 30% PG solution 0 62.8 -+ 4.0 24.6 + 3.2 5.3 + 1.6 0.36 + 0.05 0.09 + 0.05 93.1 + 1.2 1 68.0 + 5.5 16.4 -+ 2.2 7.2 -+ 3.5 0.29 -+ 0. ll 0.27 + 0.08 92.2 + 0.3 2 68.9 -+ 2.7 13.9 -+ 3.1 6.6 -+ 2.3 0.33 -+ 0.07 0.41 -+ 0.16 90.2 -+ 0.5 4 61.9 + 6.4 16.0 + 3.0 7.4 + 0.4 0.51 + 0.09 0.42 + 0.10 86.3 + 2.8 8 68.8 + 3.4 12.7 -+ 2.6 5.3 -+ 1.4 0.26 -+ 0.06 0.32 -+ 0.13 87.4 + 1.7 O/W emulsion 0 60.8 + 1.3 25.5 -+ 0.9 2.9-+ 0.7 0.85 -+ 0.28 0.04-+ 0.03 90.0-+ 2.0 1 56. l -+ 6.1 24.9 -+ 2.6 4.9 -+ 2.9 0.77 + 0.27 0.06 -+ 0.02 86.8 -+ 2.1 2 57.2 -+ 2.3 21.6 + 0.9 6.9 + 1.4 0.87 + 0.30 0.10 + 0.03 86.6 + 0.3 4 54.0 + 2.0 20.3 + 4.0 7.8 + 1.0 0.98 + 0.23 0.14 -+ 0.05 83.2 -+ 1.8 8 53.9 -+ 1.5 16.2 + 1.9 8.1 -+ 0.7 0.89 -+ 0.26 0.36 -+ 0.05 79.3 -+ 1.8 W/O emulsion 0 46.9 -+ 5.2 22.4 + 1.5 6.0 -+ 0.2 0.77 -+ 0.40 0.11 -+ 0.02 76.2 -+ 6.7 1 54.1 -+ 3.4 18.8 -+ 2.0 7.6 -+ 1.4 0.63 -+ 0.31 0.20 + 0.06 81.3 -+ 5.2 2 50.0 + 3.2 18.1 + 2.5 8.2 + 1.2 0.88 + 0.29 0.32 + 0.07 77.5 + 0.7 4 57.4 -+ 4.7 12.1 -+ 2.6 5.0 -+ 0.9 0.66 -+ 0.28 0.35 -+ 0.15 75.6 -+ 5.1 8 55.1 -+ 7.2 16.2 -+ 8.2 6.1 -+ 0.4 0.57 -+ 0.04 0.47 -+ 0.33 78.5 -+ 1.6 Non- l liposomes 0 18.4 -+ 4.2 49.7 -+ 4.5 17.2 -+ 4.0 2.59 -+ 0.90 0.22 + 0.07 88.1 -+ 3.2 1 23.1 + 4.9 32.1 + 3-5 20.6 + 3.4 2.83 + 0.84 0.40 + 0.07 79.0 + 3.6 2 23.4 -+ 5.0 26.0 -+ 4.2 19.8 -+ 5.8 2.95 + 0.82 1.15 -+ 0.11 72.5 -+ 7.0 4 19.7 -+ 4.5 29.8 + 6.0 17.5 -+ 8.1 2.02 -+ 0.80 1.81 -+ 0.49 69.0 -+ 8.0 8 16.3 + 2.0 28.0 + 5.3 I0.9 + 3.9 0.81 + 0.27 2.10 + 0.59 58.1 + 5.5 Non-2 liposomes 0 13.2 + 2.0 52.6 + 5.1 13.6 + 3.8 1.92 -+ 0.93 0.15 -+ 0.03 81.5 -+ 2.3 1 12.6 -+ 3.3 48.8 -+ 8.7 14.7 -+ 4.0 1.45 + 0.15 0.13 + 0.02 77.6 + 2.3 2 21.2 -+ 2.6 41.6 + 3.5 9.9 -+ 2.6 1.02 -+ 0.39 0.20 -+ 0.10 73.9 -+ 3.0 4 17.6 + 3.7 33.1 -+ 5.7 14.7 -+ 2.5 1.15 + 0.34 0.49 + 0.11 67.1 + 4.1 8 11.0 -+ 0.8 34.3 -+ 1.3 14.6 -+ 1.2 0.95 -+ 0.36 0.83 -+ 0.12 61.7 -+ 2.6 the formulations remain in or on the skin after swabbing, allowing sustained permeation of glycolic acid into and across the skin. The lower amounts of glycolic acid found in the living skin strata with increasing time is consistent with an increase in systemic absorption with time. The urinary data (Table I) clearly indicate an increase in systemic uptake of glycolic acid with time. It is interesting to note that the recovery of total radioactivity was substantially lower from

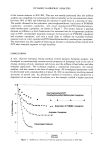
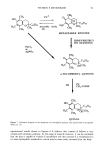
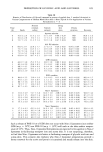
DEPOSITION OF GLYCOLIC ACID AND GLYCEROL 105 formulations that resulted in enhanced deposition into living skin strata and beyond. The amounts of glycolic acid found in the liver were around 1-2% for Non-1 formu- lations at 8 h and are clearly not substantial enough to account for the markedly lowered recoveries. Two possible explanations for the low recoveries are the enzymatic conversion of glycolic acid to carbon dioxide in living skin strata or loss of glycolic acid as a result of decarboxylation following systemic absorption via a sequence of reactions more direct than the citric acid cycle or the Krebs cycle. In this hypothetical sequence of events, glycolic acid is first converted to glyoxylate via a redox step involving FAD. Glyoxylate further undergoes reduction to formaldehyde, with the generation of carbon dioxide. Subsequent reactions involving NAD+/NADH2 complete further breakdown, with evolution of carbon dioxide (7). Although this direct conversion of acetate to carbon dioxide is energetically less favorable than the citric acid cycle (ATP yield only half of the citric acid cycle), it offers a simple explanation for loss of absorbed glycolic acid. The extent of enzymatic conversion of glycolic acid by skin was tested by incubating glycolic acid formulations with homogenates of freshly excised hairless mouse skin for varying periods of time at 37øC. It was found that the loss of radioactive glycolic acid marker was roughly 1 to 1.5 % over a 20-h incubation period. The amount of radioactive carbon dioxide respired by hairless mice following topical application of the Non-1 liposomal formulation was about 2% of the applied dose over 8 h. Thus, neither pathway for loss of glycolic acid can be considered as a major contributor to lowered recoveries. It is therefore clear that the low mass balances with formulations that allow increased depo- sition and transport of glycolic acid into systemic absorption are due to extensive redistribution of the marker within animal tissues despite the absence of any analyses of full-body marker content following excision of skin, liver, and urinary bladder. Table II shows the distribution of glycolic acid. in various strata of hairless mouse skin 16 h after topical in vitro application of select formulations. The recovery of total radioactivity was greater than 92% for all systems. A good linear correlation between amounts in the urinary bladder in vivo and in the receiver compartment in vitro was obtained (r 2 ) 0.995) however, the amounts in the receiver compartment were roughly 10- to 30-fold higher. The two factors taken together suggest that glycolic acid was possibly located in other organs such as liver, or in tissue, or that extensive metabolic conversion of glycolic acid to carbon dioxide had occurred in the in vivo experiments. Further, the, combined amounts of glycolic acid in living skin strata and receiver were Table II Distribution of Glycolic Acid (expressed as percent of formulation applied + standard deviation) in Various Strata of Hairless Mouse Skin 16 Hours After Topical In Vitro Application of Various Formulations (n ---- 3-6) Formulation Compartment Non-1 Non-2 30% PG/AQ Aqueous solution Total donor 2.0 + 0.4 3.4 -+ 4.2 1.2 + 1.0 1.2 + 1.0 Total swabs 47.4 + 13.7 10.0 + 8.7 72.9 + 2.0 79.4 -+ 5.4 Strips 1,2 17.2 + 10.7 66.1 + 9.2 11.5 + 0.3 21.1 -+ 3.3 Total strips 19.0 + 12.1 66.7 + 9.3 11.6 + 0.3 21.2 -+ 3.3 Living skin strata 3.5 + 1.5 1.1 + 0.6 0.8 + 0.3 0.9 + 0.8 Receiver 20.3 + 6.8 13.0 + 4.7 10.0 + 0.9 2.9 m 0.9 Recovery 92.2 + 4.9 94.2 + 0.9 96.1 + 1.1 105.6 + 4.3
Purchased for the exclusive use of nofirst nolast (unknown)
From: SCC Media Library & Resource Center (library.scconline.org)