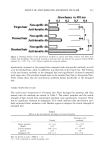
STABILTY OF LACTIC AND GLYCOLIC ACIDS 167 ANALYSIS OF AHA's AND EXCIPIENTS Assays for lactic acid and glycolic acid were performed using a Shimadzu LC-6A system with a C-3RA integrator (Shimadzu, Kyoto, Japan). The UV detector was set at 214 nm. A modified method described by Cheng and Gabbe (6) employing a 25 x 3.9-mm I.D., C•8 column (Micro Bondapack, 5pm, Waters, USA) and a mobile phase composed of water:acetonitrile (60:40 v/v) containing 3 mM ammonium dihydrogen phosphate was used. For the analysis of methyl paraben the same chromatograph and column were used. The mobile phase was water:acetronitrile (62:38 v/v). The wavelength of detection was 254 nm. Samples were diluted with the mobile phase. For both HPLC analyses a flow rate of 1 ml/min -• was used, and 20-pl samples were injected onto the column. Peak areas were used to quantify lactic acid, glycolic acid, and methyl paraben. Calibration data for the analysis methods are listed in Table I. Sorbic acid in aqueous solution has a strong absorption maximum at 258 nm due to the conjugated double-bond carbonyl system. During storage the intensity of this maximum decreases considerably and a new, very weak, absorption maximum appears between 215 and 225 nm (7). Degradation of sorbic acid in aqueous solution was followed by measuring changes in absorbency at 258 nm using a Shimadzu UV 2101 PC spectro- photometer (Shimadzu, Kyoto, Japan), and the concentration of unreacted acid was calculated from the absorbency values. Calibration data are listed in Table I. CALCULATIONS AND STATISTICAL ANALYSIS The kinetic parameters describing the degradation of the acids and excipients were determined by combination of the results from the appropriate analytical methods. By following the change in concentration as a function of time, the reaction order for degradation was estimated and used to calculate reaction rate constants, half lives, and shelf lives. Data at different temperatures were used to estimate activation energies for degradation. Activation energies, pH values, and half-life values were compared statis- tically at a 95% confidence level using the Student's t-test (Minitab, Minitab Inc., Pennsylvania, USA). Table I Calibration Data for HPLC or UV Spectrophotometric Analysis of AHAs, Methyl Paraben, and Sorbic Acid Standard Standard Correlation Concentration error of error of coefficient Compound (mg/ml- •) Slope slope Y-intercept Y-intercept (r) Lactic acid 0.05-0.10 17039 231 453 14 0.9998 0.20-1.00 28907 976 468 43 0.9996 Glycolic acid 0.20-1.00 22718 332 961 82 0.9999 Methyl paraben 0.03-0.15 11471 242 -431 11 0.9996 0.10-1.00 25996 768 -884 48 0.9999 Sorbic acid* 0.10-0.40 12.699 0.678 -0.0176 0.0008 0.9998 * UV spectrophotometric analysis.

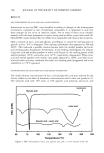
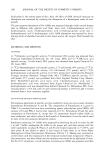
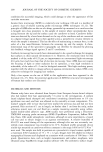
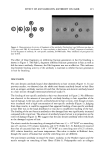
168 JOURNAL OF THE SOCIETY OF COSMETIC CHEMISTS RESULTS DSC COMPATIBILITY OF AHAs AND AHAs AND EXCIPIENTS Interactions, as seen by DSC, were classified according to changes in the thermograms of mixtures, compared to that of individual compounds. It is important to note that these changes do not occur in isolation rather, two or more of them occur simulta- neously, with the most prominent occurence being used to define a particular result (8). Overall DSC results showed that the AHAs were compatible with most of the excipients. Only a mixture of lactic acid and glycolic acid (Figure 1) caused the melting point of glycolic acid at 79øC to disappear. New melting endotherms then appeared at 200 and 260øC. This indicated a possible reaction because both the methyl paraben and lactic acid melting peaks disappeared. Furthermore, in the melting thermogram of a mixture of glycolic acid and methyl paraben or sorbic acid (Figure 2), the melting points of the methyl paraben, 126øC, and sorbic acid, 135øC, respectively, disappeared. When lactic acid and methyl paraben were mixed, extra peaks appeared at 260øC, and when lactic acid and sorbic acid were combined the sorbic acid melting peak disappeared and a new endotherm at 179øC appeared. DETERMINATION OF RATE CONSTANTS AND KINETIC PARAMETERS The initial solution concentrations of lactic acid and glycolic acid were selected for the kinetic studies on the basis of maximum concentrations used in skin care products (1). The solutions used were 10% lactic or 10% glycolic acid solutions, and lactic acid Glycolic acid I} ic acid Lact ! ! Endothermic Lactic acid Glycolic acid + Lactic acid i i i 50 75 100 125 150 175 200 Temperature (øC) Figure 1. DSC thermograms of lactic acid, glycolic acid, and a 1:1 w/w mixture of the two. 225
Purchased for the exclusive use of nofirst nolast (unknown)
From: SCC Media Library & Resource Center (library.scconline.org)