152 JOURNAL OF COSMETIC SCIENCE a skin care formulation, the water and volatile organic compounds are to a very large degree evaporated with 30 minutes. Hence, the activity structure of the formulation is determined by the residue after evaporation of volatile components (3-8). This structure is found in the phase behavior of the system, but, unfortunately, these conditions have not been studied for the ot-hydroxy acids. With this fact in mind, we found a system of ot-hydroxyoctanoic acid, a nonionic surfactant, Laureth 4, white oil, and distilled water to provide useful information about the behavior of the acid after application. White oil was chosen because it is widely used in cosmetics (6). Alpha-hydroxyoctanoic acid was chosen for this investigation, because at 3% this acid showed the highest therapeutic index of all acids in a recent evaluation. In the study, special attention is focused on phase changes, inversion of the emulsion, the position of the ot-hydroxyoctanoic acid during the evaporation process, and the final state of the emulsion. EXPERIMENTAL MATERIALS The following chemicals were used without further purification. Alpha-hydroxyoctanoic acid (99%) was from Sigma Chemical Co., St. Louis, MO polyoxyethylene-4-1auryl ether (Brij 30), Laureth 4, was from ICI Surfactants, Wilmington, DE white oil was from Penreco, Karns City, PA. Water was doubly distilled. All materials were used without further purification. PHASE DIAGRAM DETERMINATION The solubility regions were determined by addition of either water or white oil to combinations of Laureth 4/ot-hydroxyoctanoic acid, noticing the points of clarity and turbidity. The extent of the solubility regions was confirmed at first by centrifugation of samples at 5000 rpm for 30 minutes and, for samples with composition close to the solubility limit, also by storage at room temperature for several days. The liquid crystalline phases were identified by optical microscopy, with the samples between crossed polarizers, and their boundaries were confirmed by the results of small- angle x-ray diffraction based on knick points in the curves of interlayer spacing versus composition. All phase diagrams were determined at room temperature (22 ø + iøC). The three-phase areas were determined by analysis of the composition of each phase in equilibrium. The limit of the phases was determined using the following procedure: A series of samples with different ratios of ot-hydroxyoctanoic acid and surfactant in the two phases was prepared and water was added. The samples were observed under a microscope, between crossed polarizers, and the limit of three-phase areas was detected from the appearance of liquid crystal and the limit of a two-phase area was detected by disappearance of one isotropic phase. Tie lines were determined by preparing a series of samples in the emulsion region, separating them by centrifugation, and then analyzing the separated phases for composition. The two-phase emulsion region of the solid acid and oil/surfactant solution was separated by centrifugation at 5000 rpm for two minutes, and the weight ratio of each phase in equilibrium was taken and compared to those of

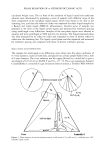
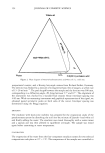
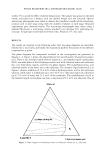
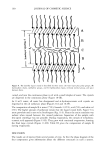
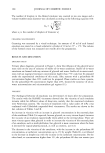
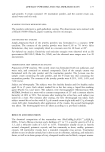
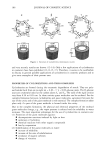
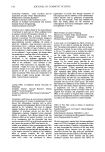
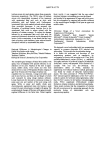
PHASE BEHAVIOR OF o•-HYDROXYOCTANOIC ACID 153 calculated weight ratio. The tie lines of the emulsion of liquid crystal and surfactant solution were determined by preparing a series of samples with different ratios of the three components in the one-phase liquid region, which were chosen to be close to the demixing line, and then the refractive index was measured for these liquid samples by a Bausch and Lomb model ABBE-3L refractometer. Another series of samples was prepared at the limit of the liquid crystal region and measured for interlayer spacing using small-angle x-ray diffraction. Samples of the two-phase region were allowed to separate and were centrifuged at 5000 rpm for two minutes. The liquid separated phase was then measured for its refractive index and compared to those of known refractive index near the demixing line. The liquid crystal phase was also separated and measured for interlayer spacing and compared with those of known interlayer spacing. SMALL ANGLE X-RAY DIFFRACTION The samples for small-angle x-ray diffraction were drawn into fine glass capillaries of 0.7-mm diameter, sealed at both ends, and placed into a brass sample holder with a hole of 2-mm diameter. The x-ray radiation was Ka copper filtered by a nickel foil to give a wavelength of 0.1542 nm at 40,000 V and 18 x 10 -3 •. The x-ray equipment, Siemens Crystallallofiex 4, consisted of a gas ionization detector system, a Tennelec PSD 100 flow ydroxyoctanoic acid LLC+L•+S• HzO+S• LLC+S•+H•O L2+ Sl LLC Water Laureth 4 Figure 1. Phase diagram of water/o•-hydroxyoctanoic acid/Laureth 4. S•: solid area. L2: solubility area. LLC: lameliar liquid crystal.
Purchased for the exclusive use of nofirst nolast (unknown)
From: SCC Media Library & Resource Center (library.scconline.org)