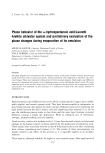
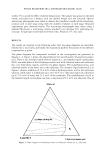
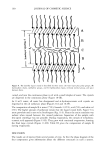
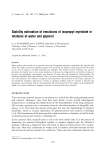
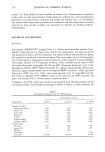
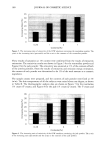
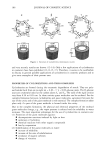
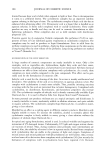
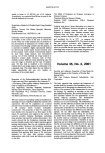
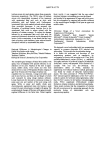
154 JOURNAL OF COSMETIC SCIENCE White oil F120+White oil+S2 Water a2o• 2-hydroxyoctanoic acid Figure 2. Phase diagram of water/ot-hydroxyoctanoic acid/white oil. S2: solid area. proportional counter, and a Kiessig low-angle camera from Richard Seifert, Germany. The detector was flushed by a mixture of nitrogen/methane, free of oxygen, at a flow rate of 15-20 ml min -•. The path length between the sample and the detector was 500 mm, corresponding to a diffraction angle, 2{}, lying between 5.7 ø and 0.7 ø. The alignment of the instrument was checked by a standard lead stearate whose interlayer spacing was 4.82 nm. With our measuring instrument and graphical representation of the signal, we obtained paired symmetric peaks on both sides of the center. Interlayer spacing was determined using the Bragg equation. EMULSION The emulsion with short-time stability was prepared for the evaporation study of the pseudoternary system by dissolving the acid into the mixture of Laureth 4 and white oil and finally adding the water. The emulsion was mixed thoroughly with a vortex mixer and a spatula and was then allowed to equilibrate overnight. The sample was mixed again before examining at room temperature. EVAPORATION The evaporation of the water from the four-component emulsion system for two selected compositions took place at 22 ø + IøC. The temperature of the sample was controlled to

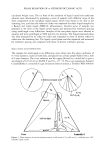
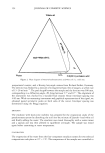
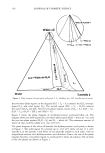
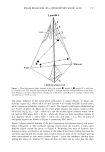
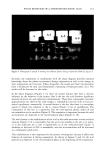
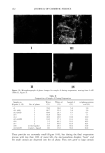
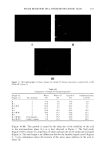
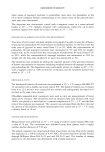
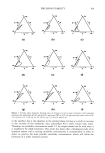
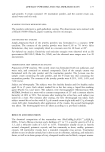
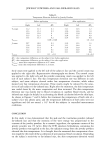
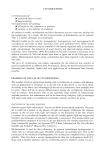
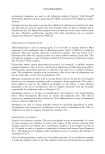
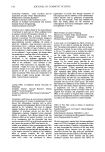
PHASE BEHAVIOR OF o•-HYDROXYOCTANOIC ACID 155 within iøC to avoid the effect of altered temperature. The sample was spread on the slide evenly, and placed on a balance until the desired weight loss was achieved. Optical microscopy photographs were taken to observe the interfacial transfer of the o•-hydroxy- octanoic acid in each stage along with the number of phases in each stage. Repeated experiments gave identical results. The microscope photographs were taken using a polaroid Microcam, a microscope camera attached to an olympus B11 polarizing mi- croscope. A high-speed and black-and-white film, Polaroid 337, was used. RESULTS The results are reported in the following order: first the phase diagrams are described, followed by x-ray results, and finally the evaporation path for the system of two different compositions is given. The phase diagrams for compounds involved in the investigation are presented in Figures 1-4. Figure 1 shows the phase behavior for water/Laureth 4/o•-hydroxyoctanoic acid. There is one isotropic liquid solution region (L2) , one lameliar liquid crystal phase (LLC), one solid phase of the o•-hydroxyoctanoic acid with dissolved water and surfactant (S1), two three-phase regions, and five two-phase regions. The o•-hydroxyoctanoic acid dissolved neither in the water nor in the surfactant. The isotropic liquid solution (L2) in Figure 1 shows a solubility of 22.0 wt% of the o•-hydroxyoctanoic acid in the surfactant solution, while water is solubilized up to 20.3 wt% in it. The solid region (S•) dissolved up to 27.6 wt% of water and 31.4 wt% of the surfactant. The solubilization of acid in the lameliar liquid crystal phase was low a maximum of 6.5 wt% was observed. One of White oil Figure 3. Phase diagram of o•-hydroxyocranoic acid/Laureth 4/white oil. Sj: solid area.
Purchased for the exclusive use of nofirst nolast (unknown)
From: SCC Media Library & Resource Center (library.scconline.org)