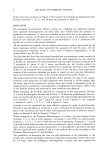
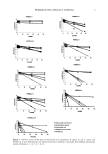
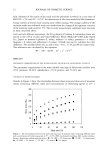
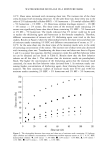
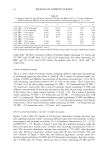
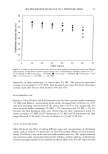
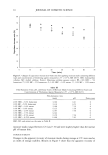
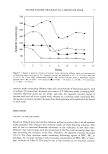
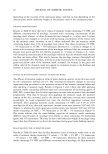
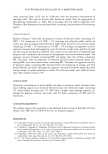
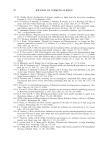
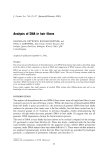
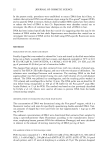
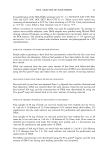
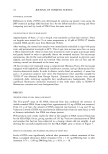
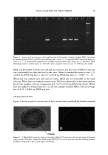
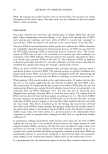
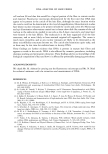
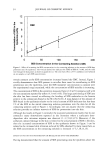
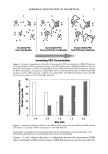
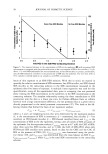
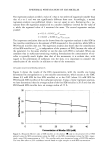
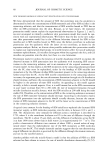
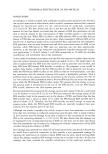
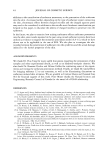
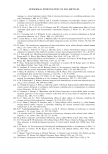
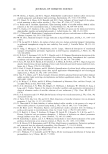
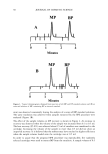
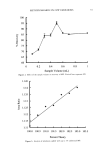
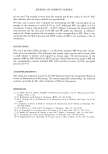
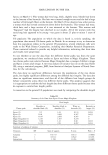
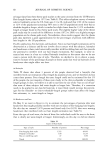
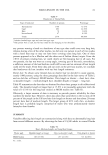
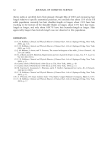
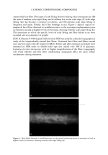
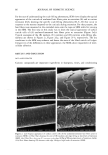
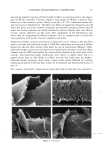
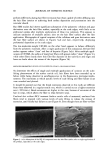
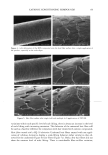
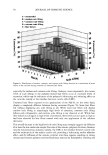
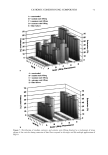
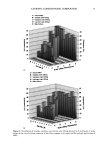
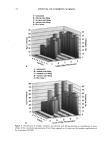
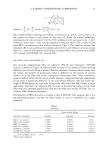
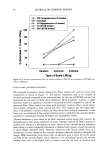
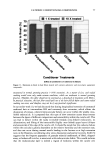
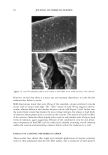
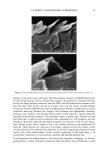
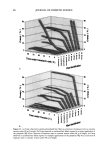
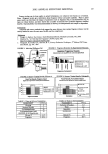
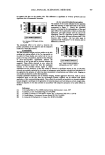
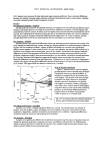
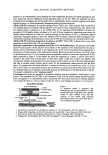
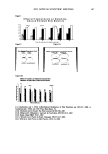
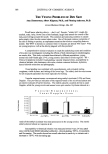
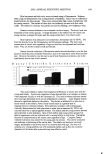
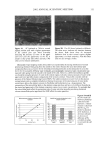
2002 ANNUAL SCIENTIFIC MEETING 111 Figure 2A SC hydrated to 70%w/w reveals slightly swollen cells with a lighter appearance in the central part (see black asterisks) indicating the presence of water. In the upper and lower part the appearance of the SC is similar to that of dry skin (white asterisks). The white arrows indicate undulations. Figure 2B Two SC sheets hydrated to 90%w/w. The white arrow indicates the interface between the sheets. Both sheets show an increased hydration level in their central regions (lighter appearance, see black asterisks). Note that these cells are also strongly swollen. Discussion: Tape-stripping studies always show an exponentially decreasing distribution of inward penetrating chemical when going from the outside to the inside. Because the same intercellular lipid composition that acts as a barrier for the inwardly penetrating molecules is also anticipated to act as the harrier for the outwardly diffi•sing water molecules, an exponentially increasing wamr concentration was expected when going from the outside to the inside of the skin. However, a different distribution profile was found favoring the presence of water in the central regions with only minimal amounts of water in the upper and lower part (the stratum compactum) of the stratum corneum. This profile coincides with the presence of the Natural Moisturizing Factor (NMF). The sudden reduction in water levels in the stratum compactum prevents a complete dehydration whereas the presence of elevated amounts of water in the central layers allows the stratum corneum its flexibility and biochemistry {e.g., desquamation). The composition of the intercellular lipids in the stratum compacturn does not have to be different from that in the central and upper parts of the stratum corneum to cause a lower water concentration. We postulate that the intercellular lipids affect the permeation rates of water and other inwardly penetrating chemicals whereas intracellular polar ingredients like NMF affect the water quantities. Figures 3A and B Mean thickness of cells as a function of SC hydratlon 3.5 2.5 1.5 1 0.,5 0 100 200 300 Hydrat•on %w/w 100 90 80 70 60 50 40 30 20 10 0 400 (Itot)2/A as function of hydratlon level of stratum comeurn 18-26% w/w 57-87% w/w 292-332% w/w (NEBO (Na2C03} (H20} (/1) The mean cell thickness plotted as a ftruction of SC hydration. /1 linear relation is observed (B) The plotted as fitnction of SC hydration. A tlecrease indicates an increase in efficiency of the cornified envelope to surround the cell content
Purchased for the exclusive use of nofirst nolast (unknown)
From: SCC Media Library & Resource Center (library.scconline.org)