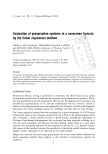
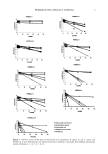
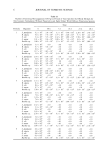
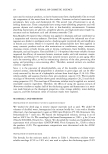
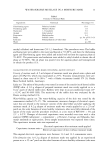
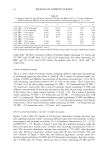
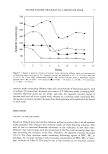
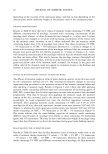
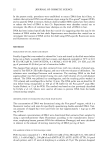
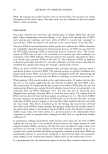
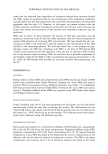
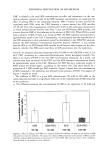
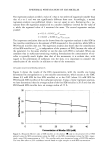
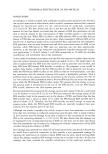
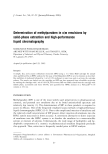
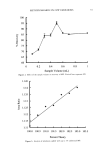
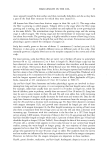
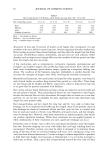
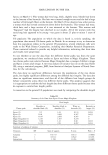
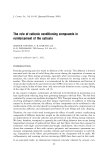
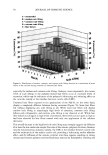
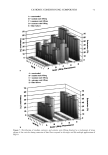
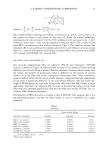
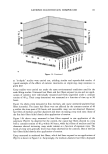
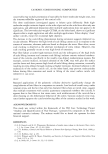
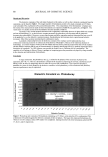
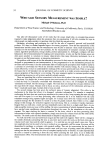
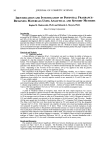
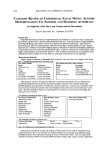
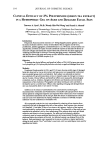
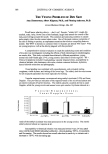
WATER-SOLUBLE MUCILAGE IN A MOISTURE MASK 17 3500 3000 • 2500 o 2000 .•--• • 15oo :• lOOO 500 o o e____e 0 2 4 6 8 lO 12 14 16 Weeks Figure 5. Changes in apparent viscosity of moisture masks containing different types and concentrations of thickening agents over time at 4øC. Apparent viscosity was measured at 25 ø + 0.2øC with a shear rate of 100 1/s for 3 min. HEC: hydroxyethyl cellulose. MC: methyl cellulose. Extract: &lonostroma nitidiam aqueous extract. ', 2% HEC + 5% humectant. l, 1% HEC + 1% extract. /•, 2% MC + 5% humectant. O, 1% MC + 1% extract. moisture masks containing different types and concentrations of thickening agents, with or without 5% humectant, decreased over time at 4øC. Moisture masks containing HEC remained relatively stable for six weeks, and then the apparent viscosity began to decrease and level off at the eighth week, whereas in a moisture mask containing MC, the apparent viscosity started to decrease from the beginning and leveled off at the fourth or sixth week. DISCUSSION VISCOSITY OF MOISTURE MASKS Results in Table II show that the flow behavior indexes (n) are less than 1 for all moisture masks prepared. This indicates that moisture masks are shear-thinning solutions. This may be due to rotational Brownian movement of the molecules in low shear rates. However, they tend to align with the stream line of the flow with increasing shear rate, thus decreasing the resistance of the flow. Therefore, the apparent viscosity decreased (12-14). For those moisture masks containing thickening agents of HEC, MC, or mucilage, the viscosity increased with increasing concentration of HEC, MC, or muci- lage, as shown in Table II. This may be due to the viscosity of o/w emulsion systems,

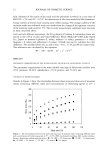
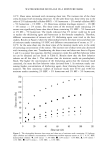
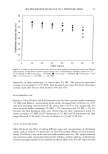
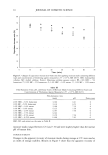
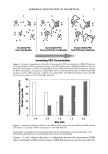
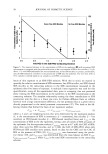
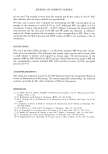
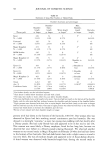
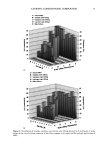
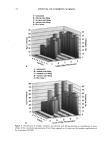
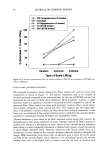
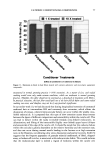
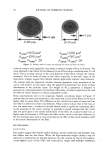
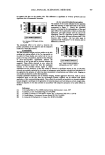
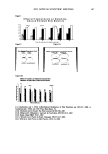
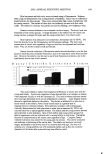
18 JOURNAL OF COSMETIC SCIENCE depending on the viscosity of the continuous phase, and that in turn depending on the concentration and/or molecular weight of the polymer used in the continuous phase. COLOR OF MOISTURE MASKS Results in Table II show that the L values of moisture masks containing 1% HEC and different concentrations of mucilage increased with increasing concentration of the mucilage used, whereas +a values decreased or even changed to -a values, and -b values increased or even changed to +b values with increasing concentration of the extract used in the moisture mask. Increases in the L values indicated that the moisture masks containing higher than 1.5% of mucilage were whiter than those containing 2% HEC + 5% humectant or 2% MC + 5% humectant. Decreases in +a values or changes to -a values with increasing concentration of the mucilages indicated that the moisture mask became more green and less red, whereas increases in -b values or changes to b+ values with increasing concentration of the mucilage indicated that the moisture mask became less blue and more yellow. This may be because the mucilage contains chlorophyll and some carotenoids (28). Therefore, with the increased concentration of mucliage used, the green and yellow color of the moisture mask increased. An increase in the green and yellow color of the moisture mask may appeal to consumers owing to the freshness and warmth of nature associated with these colors. EFFECTS ON WATER-HOLDING CAPACITY OF MOISTURE MASKS The efficacy of moisture masks in terms of water-holding capacity on the skin was tested by the corneometer method (25-27). The corneometer measures changes in electrical capacitance that are related to the moisture content of the stratum corneum before and after applying a moisture mask. Results in Figures 3 and 4 show that after applying moisture masks containing different types and concentrations of thickening agents of HEC, MC, or mucilage, the electrical capacitance increase ratio increased, then decreased progressively. This may be because after applying the moisture mask, the moisture content of the skin increased, and so the electrical capacitance increase ratio increased accordingly. As water evaporated over time, the electrical capacitance increase ratio decreased. After applying moisture masks containing 1% HEC and 0.5% to 2.0% mucilage for 60 min, electrical capacitance increase ratios were between 59% and 42% (Figure 3), whereas electrical capacitance increase ratios were between 59% and 45% for masks containing 2% HEC + 5% humectant or 2% MC + 5% humectant (Figure 4). The results indicate that the water-holding capacities of moisture masks containing different concentrations of mucilage were similar to those containing 2% thickening agents and 5 % humectants. This may be due to the molecular weight of mucilage being larger than that of humecant or due to the mucilage having good water-holding capacity. FILM-FORMATION TIME OF MOISTURE MASKS Results in Table III show that the film-formation times of moisture masks were in the order of moisture masks containing 1% extract + 1% MC 2% MC + 5% humectant 1% extract + 1% HEC 2% HEC + 5% humectant. However, for those moisture masks containing 1% HEC and different concentrations of mucilage, the film-formation
Purchased for the exclusive use of nofirst nolast (unknown)
From: SCC Media Library & Resource Center (library.scconline.org)