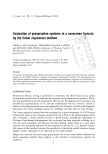
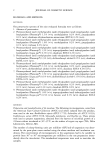
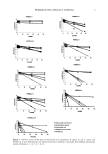
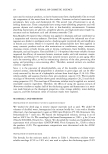
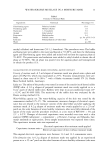
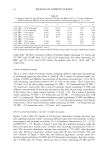
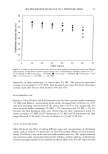
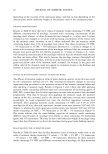
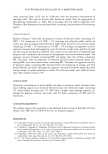
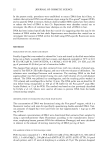
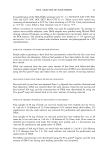
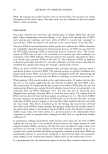
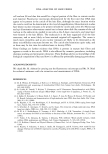
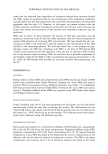
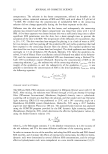
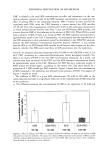
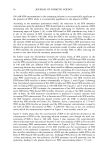
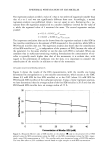
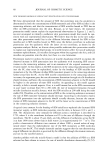
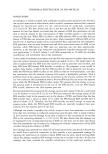
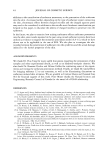
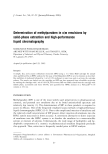
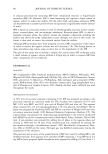
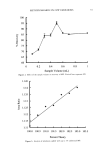
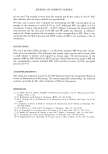
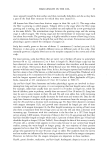
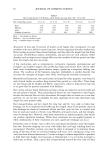
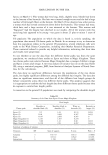
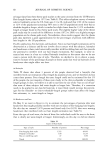
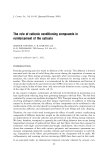
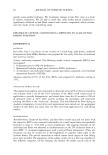
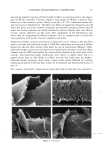
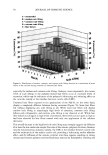
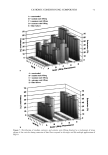
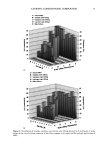
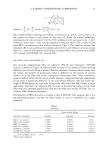
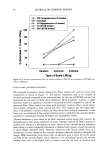
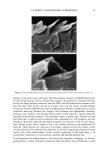
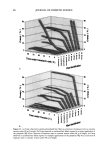
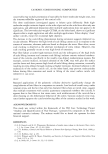
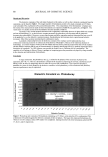
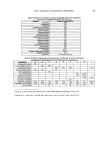
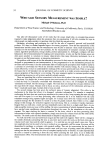
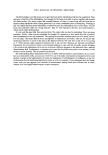
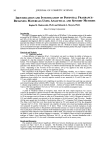
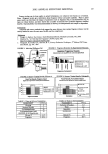
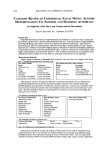
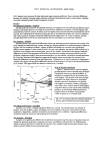
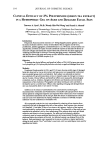
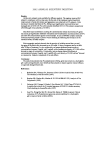
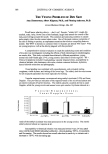
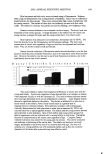
50 JOURNAL OF COSMETIC SCIENCE MP BP I I I I 0 1 2 3 Minutes MP BP B I I I I 0 1 2 3 Minutes Figure 1. Typical chromatograms obtained from injection of (A) MP and BP standard solution and (B) an extracted solution of MP containing BP as internal standard. min) was observed consistently during the analysis of a series of MP standard solutions. The same resolution was achieved when samples extracted by the SPE procedure were analyzed (Figure lB). The effect of the sample volume on MP recovery is shown in Figure 2. An increase in recovery was observed when the volume of the sample was increased from O. 1 to 0.5 mi. The best recovery (95.0%) was achieved when 0.5 ml of emulsion was transferred to the cartridge. Increasing the volume of the sample to more than 0.5 ml did not show an improved recovery. It is believed that the sorbent may have reached its highest efficiency when the sample volume loaded onto the cartridge was at 0.5 mi. In order to assure that the proposed SPE procedure was reproducible, five randomly selected cartridges were used to extract MP from the emulsion. A sample volume of 0.5

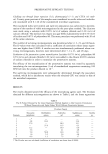
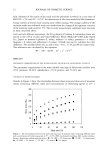
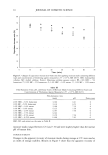
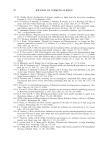
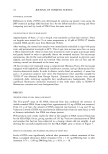
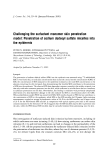
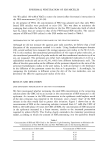
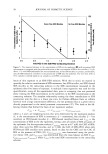
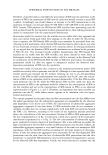
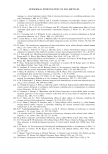
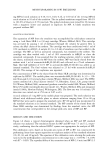
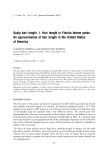
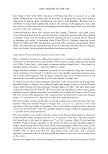
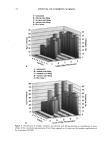
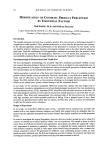
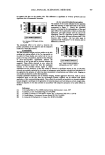
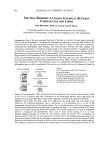
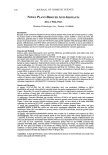
METHYLPARABEN IN O/W EMULSIONS 51 100 - 95 90 85 80 75 70 65 60 I I I I I 0.2 0.4 0.6 0.8 1 Sample Volume (mL) Figure 2. Effect of the sample volume on recovery of MP. Vertical bars represent SD. 1.145 1.14 1.135 1.13 1.125 1.12 1.115 1.11 100.0 100.5 101.0 101.5 102.0 102.5 103.0 103.5 Percent Theory Figure 3. Analysis of emulsions spiked with up to 3% additional MP.
Purchased for the exclusive use of nofirst nolast (unknown)
From: SCC Media Library & Resource Center (library.scconline.org)