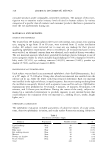
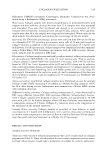
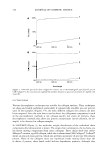
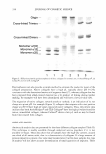
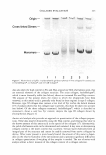
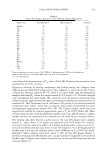
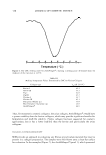
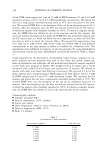
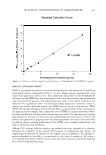
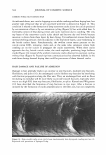
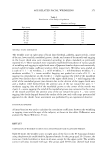
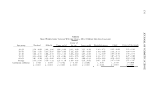
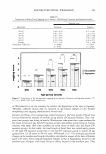
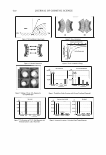
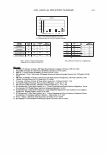
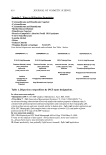
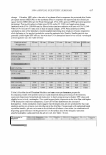
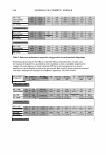
346 JOURNAL OF COSMETIC SCIENCE 10-ml PTFE screw-capped vial 1 ml of 1.5 mM of PFPH solution, 0.5 ml of 0.5 mM deuterated acetone, and 0.5 ml of 0.5 mM formaldehyde concentration. We placed the vial into a temperature-controlled heating block at 35°C after sonication for five min utes. We inserted SPME fiber in the heads pace of the vial for an adsorption period of 15 minutes. After the adsorption step, the fiber was directly inserted into the GC injector, in which the analytes were thermally desorbed at 250°C. To obtain a complete desorp tion, the SPME fiber was allowed to stay in the injection port for five minutes. For successive analysis of samples in this work, the SPME fiber was always first exposed onto the GC injector port as a blank run before the next experiment, to make sure the fiber was clean as well as to avoid the carryover effects. We repeated the experiment using 0.25 mM, 0.125 mM, 0.0625 mM, 0.0313 mM, and 0.0010 mM of formaldehyde concentrations in the same manner as before, to establish the calibration curve. The experiments were performed in triplicate. A plot was generated by using formaldehyde concentration vs peak area ratio: formaldehyde derivative/IS derivative (Table I, Figure 2). Sample preparation for the determination of formaldehyde content. Various categories of cos metic products and raw materials were used in this study: nail polish, shower gel, make-up foundation, and surfactant. All raw materials and cosmetics samples employed in this work were prepared as follows: We weighed 0. 50 g of sample into a 50-ml volumetric flask, added 20 ml of water, and sonicated for 15 minutes. We diluted to volume with water and mixed well (filtering if necessary). We pipetted 0.5 ml of the above solution into a 10-ml heads pace PTFE-capped vial, then added 1 ml of 1. 5 mM of PFPH solution and 0.5 ml of 0.5 mM deuterated acetone. We sonicated for five minutes and placed the vial into a temperature-controlled heating block at 35°C. We inserted SPME fiber into the headspace of the vial for an adsorption period of 15 minutes. After the adsorption step, the fiber was directly inserted into the GC injector, in which the analytes were thermally desorbed at 250 ° C. To obtain a complete desorp tion, the SPME fiber was allowed to stay in the injection port for five minutes. Chromatographic conditions • Column: non-polar HP-1 • Injector temperature: 250°C, splitless • Carrier gas: helium • Oven temperature: 100°C (5 min), 10°C/min, to 300°C. • Detector temperature (FID): 275°C • Flow: 1.2 ml/min Table I Concentration vs Peak Area Rado Concentration (µg/ml) 17.7000 8.8500 4.4250 2.2125 1.1063 0.0350 0.0000 Peak area ratio 9.538 4.590 2.128 1.231 0.692 0.026 0.000

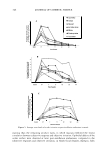
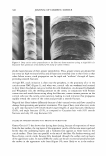
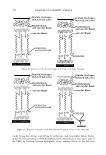
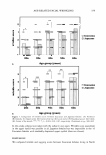
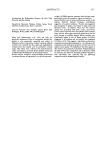
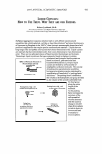
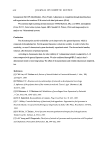
12 a, .:J 10 · a, ,,c: !!2 a, 8 ca ·c: ,,a, 6 ':r.N 0 4 .:J ca ca 2 ca a, 0 HS-SPME-GC DETERMINATION OF FORMALDEHYDE 347 Standard Calibration Curve R2 = 0.999 0 5 10 15 20 Formaldehyde Concentration (µg / ml) Figure 2. Calibration curve for quantitative determination of formaldehyde via HS-SPME-GC method. RES UL TS AND DISCUSSION SPME is a powerful alternative to traditional techniques for the extraction of volatile or semivolatile organic compounds (9,16). It is a fast, simple, precise, and sensitive tech nique that requires no solvent (17). The adsorption time profile of the formaldehyde derivative on the SPME fiber was investigated, and it was observed that the equilibrium time was around 60 minutes. The selected exposure time in the current study does not represent the equilibrium time. Conventional sample preparation methods intend to remove the analytes from the sample, but SPME does not work in that manner. With SPME, the amount of analyte removed by the fiber is proportional to the concentration of compound in the sample. This permits the use of SPME on a quantitative basis before reaching equilibrium, allowing much shorter exposure times. For the purpose of current experiments, 15 minutes of extraction time yielded sufficient extraction (ca 75%) of the analyte. For quantitation purposes there are several parameters that need to be controlled in order to ensure optimum performance of the SPME: ionic strength, temperature, and time of adsorption and desorption. Adding 25 % sodium chloride solution can enhance the ionic strength of a solution, reducing the solubility of the analyte. Fluctuations of temperature can change the equilibrium distribution of analytes in the sample and the headspace. The amount of analyte adsorbed on the fiber is proportional to the time of extraction. By using a 0.75-mm ID inlet liner in the GC injector port, the linear velocity increased through the liner, which sharpened the peaks.
Purchased for the exclusive use of nofirst nolast (unknown)
From: SCC Media Library & Resource Center (library.scconline.org)