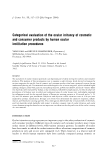
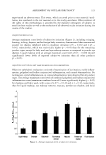
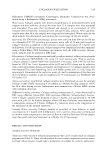
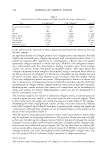
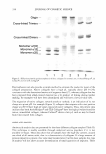
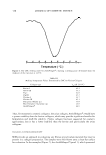
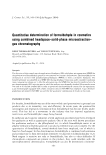
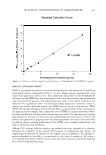
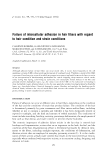
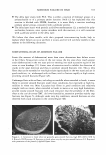
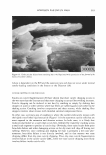
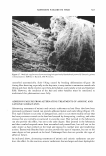
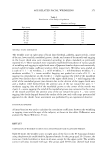
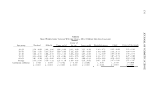
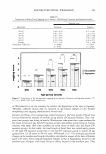
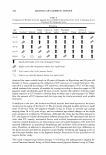
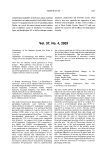
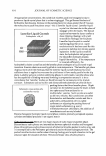
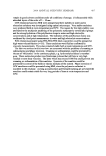
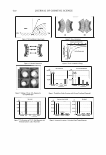
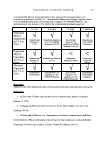
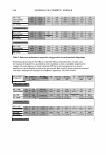
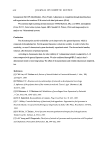
12 a, .:J 10 · a, ,,c: !!2 a, 8 ca ·c: ,,a, 6 ':r.N 0 4 .:J ca ca 2 ca a, 0 HS-SPME-GC DETERMINATION OF FORMALDEHYDE 347 Standard Calibration Curve R2 = 0.999 0 5 10 15 20 Formaldehyde Concentration (µg / ml) Figure 2. Calibration curve for quantitative determination of formaldehyde via HS-SPME-GC method. RES UL TS AND DISCUSSION SPME is a powerful alternative to traditional techniques for the extraction of volatile or semivolatile organic compounds (9,16). It is a fast, simple, precise, and sensitive tech nique that requires no solvent (17). The adsorption time profile of the formaldehyde derivative on the SPME fiber was investigated, and it was observed that the equilibrium time was around 60 minutes. The selected exposure time in the current study does not represent the equilibrium time. Conventional sample preparation methods intend to remove the analytes from the sample, but SPME does not work in that manner. With SPME, the amount of analyte removed by the fiber is proportional to the concentration of compound in the sample. This permits the use of SPME on a quantitative basis before reaching equilibrium, allowing much shorter exposure times. For the purpose of current experiments, 15 minutes of extraction time yielded sufficient extraction (ca 75%) of the analyte. For quantitation purposes there are several parameters that need to be controlled in order to ensure optimum performance of the SPME: ionic strength, temperature, and time of adsorption and desorption. Adding 25 % sodium chloride solution can enhance the ionic strength of a solution, reducing the solubility of the analyte. Fluctuations of temperature can change the equilibrium distribution of analytes in the sample and the headspace. The amount of analyte adsorbed on the fiber is proportional to the time of extraction. By using a 0.75-mm ID inlet liner in the GC injector port, the linear velocity increased through the liner, which sharpened the peaks.

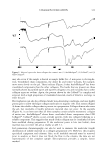
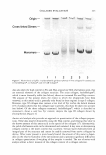
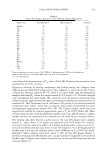
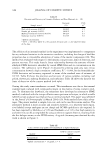
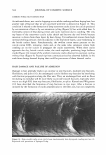
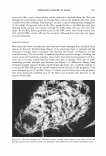
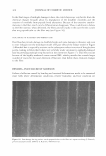
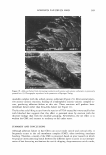
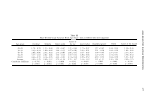
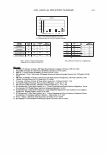
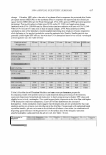
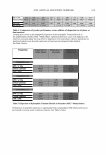
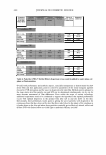
348 JOURNAL OF COSMETIC SCIENCE Table II Precision and Recovery in Cosmetic Products and Raw Materials (n = 10) Sample tested Nail polish recovery (0.05%t Shower gel recovery (0.05%) Makeup foundation recovery (0.05 % ) Surfactant recovery (0.05%) a Spiked concentration. Recovery (%) 89.00% 98.01 % 90.42% 91.18% CV% (r/ 9.5 4.1 6.3 5.6 6 CV% = 100 (Six), where S is the standard deviation and x is the observed mean of the data. The addition of an internal standard in the experiment was implemented to compensate for any undesired variation in the extraction condition, including the change of the fiber properties due to irreversible adsorption of some of the matrix components (18). This method was evaluated with respect to the linearity, run precision, limit of detection, and percent recovery. This study found a linear relationship between the amounts of form aldehyde-PFPH derivative adsorbed by coated SPME fiber and its concentration in the solution. The calibration curve (Figure 2) obtained by plotting peak area ratio versus concentration showed a high correlation coefficient, R2 0.999, for the formaldehyde PFPH derivative and accuracy, expressed in terms of the standard error of estimate, of 0.13 5 3. Table II shows the precision and recovery of various samples, including nail polish, shower gel, makeup foundation, and surfactant. Table III shows the data for the limit of detection of the current method (vide infra). During this study some interference occurred. This interference was due to the internal standard peak coeluted with compounds present in the matrix of some cosmetic prod ucts. To eliminate this drawback, the researchers have developed an alternative SPME method, combined with the isotope dilution mass spectrum technique, in which a stable labeled isotope analogue was employed as an internal standard. This paper was published in the journal of Chromatography A (March 2004) (19). Both methods have their advan tages. The present method is simple, low-cost, and can be used for routine analysis. The alternative method is more accurate and sensitive however, it is relatively more expen sive (labeled isotope analogues are not cheap) and GC/MS capability is also required. It has been reported by Hoshika et al. (20) and Stashenko et al. (21), that high sensitivity and selectivity can be accomplished by using an electron capture detector, resulting from the five halogen atoms on the PFPH moiety. A typical chromatogram obtained for this work is shown in Figure 3. Table III Limit of Detection (LOD) of Formaldehyde in Spiked Surfactant Analyte Formaldehyde a Spiked concentration = 15 µg/ml n = 8. LOD in current researcha (µg/ml) 0.04
Purchased for the exclusive use of nofirst nolast (unknown)
From: SCC Media Library & Resource Center (library.scconline.org)