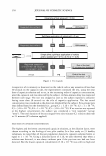
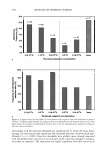
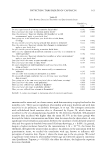
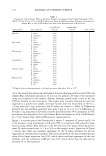
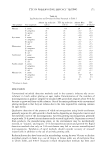
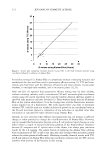
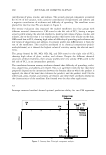
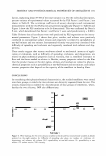
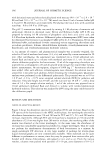
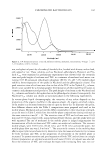
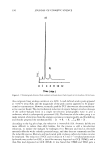
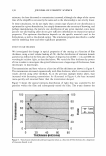
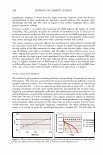
170 JOURNAL OF COSMETIC SCIENCE Table I Comparison of Preservative Efficacy Test Data Without Counting Colonies Using Enrichment of LB With TCC for 48 h at 35°C in 96-Well Microtiter Plates and LB Enrichment Followed by Addition of Alamar Blue to the 96-Well Microtiter Plates and Determination of Fluorescence Test product Mascara Eye cream Moisturizer Conditioner Sunless tanner Mascara tint Test organism S. aureus P. aeruginosa B. cepacia E. coli S. aureus P. aeruginosa B. cepacia E. coli S. aureus P. aeruginosa B. cepacia E. coli S. aureus P. aeruginosa B. cepacia E. coli S. aureus P. aeruginosa B. cepacia E. coli S. aureus P. aeruginosa B. cepacia E. coli Log CPU/ml Alamar Blue (initial) (24 h)* 6.86 6 6.49 0 6.18 0 6.63 0 6.18 2 6.79 0 6.46 0 6.94 0 6.86 0 6.49 0 6.18 0 6.63 0 6.74 0 6.36 0 6.04 0 6.52 0 6.74 0 6.36 0 6.04 0 6.52 0 6.97 6 6.49 3 6.49 2 6.38 4 * Highest dilution showing growth in 96-well microtiter plate after 48 h at 35°C. TTC (24 h)* 6 0 0 0 3 0 0 0 0 0 0 0 0 0 0 0 0 0 0 0 6 3 2 4 coli at the time of inoculation and the highest dilution showing growth in both TTC and Alamar Blue enrichment systems at 24 h in six test products. D-values were calculated using the reciprocal of the highest dilution showing growth (pink color) as the log CFU/ml bacteria at each time point. The results were virtually identical for each test organism in a specific test sample, and most bacteria were not recoverable at 24 h (i.e., 6-log reduction). Log reductions and D-values are shown in Table II. Differences between the two methods generally were only 1-log at 24 h or 1-2 h differences in D-values. Log reductions or D-values could be determined after 48-h incubation in TTC enrichment and after about 50 h with Alamar Blue (enrichment for 48 h in LB followed by 2 h for Alamar Blue addition/fluorescence measurements). Figure 1 is a scatter plot of the D-values for S. aureus, P. aeruginosa, B. cepacia, and E. coli in 44 products using enrichment in LB with TTC as a function of D-values for these bacteria using Alamar Blue addition to the 96-well microtiter plates following enrich- ment. D-values ranged from 3.3 h to 30 h in the samples tested. Inspection of Figure 1 reveals that there was excellent agreement of the D-values obtained for all test organisms in virtually all test samples. Statistical treatment of the data revealed that the slope of the linear regression was 0.98, which shows excellent agreement of the two methods, and the correlation coefficient was 0.98, which shows that the data had an excellent fit to the regression.

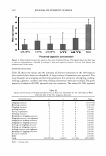
TTC IN PRESERVATIVE EFFICACY TESTING 171 Table II Log Reductions and D-values for Data Presented in Table I Alamar log reduction TTC log reduction Alamar Blue TTC Test product Test organism (24 h) (24 h) D-values* D-values* Mascara S. aureus 0.9 0.9 28 28 P. aeruginosa 6 6 3.7 3.7 B. cepacia 6 6 3.9 3.9 E. coli 6 6 3.6 3.6 Eye cream S. aureus 4 3 4.6 5.7 P. aeruginosa 6 6 3.5 3.5 B. cepacia 6 6 3.7 3.7 E. coli 6 6 3.5 3.5 Moisturizer S. aureus 6 6 3.5 3.5 P. aeruginosa 6 6 3.7 3.7 B. cepacia 6 6 3.9 3.9 E. coli 6 6 3.6 3.6 Conditioner S. aureus 6 6 3.6 3.6 P. aeruginosa 6 6 3.8 3.8 B. cepacia 6 6 4.0 4.0 E. coli 6 6 3.7 3.7 Sunless tanner S. aureus 6 6 3.6 3.6 P. aeruginosa 6 6 3.8 3.8 B. cepacia 6 6 4.0 4.0 E. coli 6 6 3.7 3.7 Mascara tint S. aureus 1 1 25 25 P. aeruginosa 3 3 6.9 6.9 B. cepacia 4 4 5.3 5.3 E. coli 2 2 10 10 * D-values in hours. DISCUSSION Conventional microbial detection methods used in the cosmetic industry rely on en- richment in broth and/or plating on agar media. Determination of the numbers of microorganisms in product samples by standard APC procedures requires about 48 h for bacteria to grow and form visible colonies. One of the major problems with conventional plating methods is that they are tedious due to the time required for counting colonies on agar media. Qualitative detection of the presence of viable microorganisms using broth enrichment generally requires 24-48 h growth in broth media, depending on the product matrix and the metabolic state of the microorganisms. Actively growing microorganisms generally require only 24-h growth in enrichment media to reach high levels. Organisms recovered from products, the manufacturing plant, or the environment may be metabolically stressed, or "injured," and require 24 h for repair/resuscitation and growth (9). Rapid detection methods that rely on 24-h enrichment may fail to recover stressed/injured microorganisms. Validation of rapid methods should consider recovery of stressed/ injured cells in addition to the use of actively growing cells. Redox indicator dyes have been used in microbiology testing for over 5 0 years to disclose microbial growth in foods (e.g., use of litmus in litmus milk, use of methylene blue in Ulrich milk), and 0.01 % resazurin in fluid thioglycollate medium has been used
Purchased for the exclusive use of nofirst nolast (unknown)
From: SCC Media Library & Resource Center (library.scconline.org)