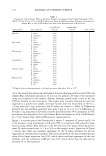
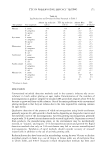
178 JOURNAL OF COSMETIC SCIENCE gravity action at one-half minute and at one minute, by discharging 500 µl of emollient at 20° ± 1 ° C over a glass dish. Two perpendicular diameters of the area occupied by the sample at a half minute and at one minute (S0.5 and Sl) were measured and the mean calculated. Five determinations were performed for each emollient, and the homogeneity of variance of the data set was studied in order to verify that the values were comparable. Viscosity determination. The viscosity of the emollients was measured employing a Brook- field LVT viscometer. Measurements were carried out employing Spindle No. 1 at 60 rpm. Samples were thermostatized at 20° ± 1 ° C. Ten determinations were performed for each emollient, and the homogeneity of variance of the data set was studied in order to verify if the values were comparable. Surface tension determination. The surface tension of each emollient was determined by stalagmometry (13, 14). The method consists of weighing a drop of emollient obtained from the end of a calibrated capilar tube and determining the surface tension by means of a calibration plot. In order to draw the calibration plot, ten drops of known surface tension standards [diethyl ether, ethyl alcohol (absolute), chloroform, and carbon disul- fide (all HPLC grade), and distilled water} were accurately weighed in a milligram balance. The calibration plot that correlates drop weight with surface tension for each of the standards was obtained by regression analysis. A linear model with its y-intercept through the origin (direct proportionality), with a significance level of 95% (equation 1), was accepted: P 10 = 0.357 Xu (1) in which CT = surface tension (din/cm) and P 10 = weight of 10 drops (mg). Ten drops of each emollient were weighed and their corresponding surface tensions were determined by means of the calibration plot. All determinations were carried out at a constant temperature of 20° ± 1 ° C. DATA ANALYSIS A three-factor (assessor, sample, repetition) analysis of variance (ANOV A) was per- formed for all samples on the sensory data obtained. The mean rating and Fisher's least significant differences for each term were calculated by ANOV A. Principal component analysis (PCA) of mean ratings for each sensory and instrumental attribute was used to illustrate the relationship among variables and samples. All statistical analyses were performed using Statistica 5 .1 software (StatSoft Inc., USA). Linear partial least squares regression analysis (PLS) was used to analyze the relationships between sensory and physical matrices (15,16). PLS extracts a few linear combinations (PLS factors) from the physical data that predict as much of the systematic variations in the sensory data as possible. Because of the multivariate nature of the sensory data, PLS2 was performed ( 15), and all the sensory variables were correlated versus all the instru- mental variables simultaneously. Osten's F-test (17) was used to determine the number of significant (p 0.05) factors. The Gens tat statistical language Release 4.1, Numerical Algorithms Group (18) was used for these analyses. RES UL TS AND DISCUSSION ANOVA showed that between-repetition and between-assessor variations were not sig-

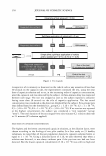
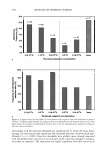
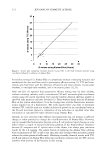
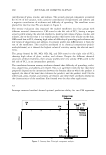
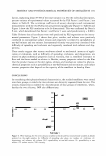
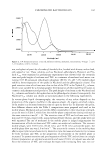
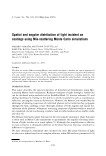
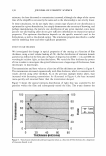
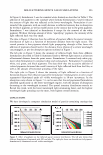
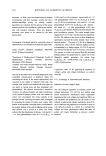
SENSORY AND PHYSICOCHEMICAL PROPERTIES OF EMOLLIENTS 179 nificant (p 0.05), and neither were assessor-repetition, assessor-sample, and repetition- sample interactions. ANOV A showed all parameters (sensory and instrumental) to be significant in discriminating among samples (p 0.001), results that support the validity of the chosen descriptors in developing the sensory profile. INSTRUMENTAL DATA PRINCIPAL COMPONENT ANALYSIS (PCA) In the PCA of the instrumental data for the eight samples, the first two principal components (PC) accounted for 62.6% and 34.4% of the variance, respectively. The first PC (PCl) contrasted surface tension (positively) with spreadability at one-half minute (S0.5) and one minute (Sl) (negatively). The second PC (PC2) was defined negatively by viscosity. The emollient scores for the first two PCs are plotted in Figure 1. Coordinate analysis enabled the discrimination of different groups of emollients accord- ing to the evaluated physicochemical properties. CM scored to the left side of the first PC, showing high values of spreadability at one-half minute and one minute and low values of surface tension. DM scored low in PC2, showing high values of viscosity. A group, including SO, MO, and SQ, scored to the right side of PCl, showing high values of surface tension and spreadability at one-half minute and one minute. The group formed by IPM, DO, and OD showed intermediate properties. The two silicones showed a different behavior. The high viscosity of DM did not result in difficulty of spreading under the action of gravity, as could be predicted, showing similar values of spreadability and surface tension to those of OD or MO. CM showed unique characteristics: its spreadability was approximately twice that of the rest of the emollients. SENSORY DATA PRINCIPAL COMPONENT ANALYSIS The first principal component accounted for 59.7% of the variance, with a positive . �o 1PM ♦ 0.5 ��SQ C_M � ... 2 \0.s -2 -1.5 -1 -0.5 I oo. 0.5 Surface tension S1 -0.5 -1 -1.5 -2 OM • ""' PC 1 Viscosity Figure 1. Instrumental data: Principal component analysis.
Purchased for the exclusive use of nofirst nolast (unknown)
From: SCC Media Library & Resource Center (library.scconline.org)