38 JOURNAL OF COSMETIC SCIENCE
PROCEDURES
Sample preparation (skin-whitening cream). About 0.5 g of each whitening cream was
accurately weighed and transferred into three separate 25-ml volumetric flasks and
dissolved in methanol. To each flask 50 µg/ml- 1 of resorcinol was added as an internal
standard. The solution was sonicated vigorously for 30 min, centrifuged at 4000 rpm for
30 min, and filtered on a Millipore membrane (0.45 µm) to obtain a transparent
solution. The supernatant liquid was used for chromatographic analysis.
Extraction of medicinal plants. The dried medicinal plants were powdered. Then 6 kg of
the powder was extracted with two successive portions of 5 .0 1 of de-ionized water and
methanol. They were shaken in a wrist-action shaker for five hours and filtered. Then the
solvent of the filtrate could be removed either by using a spray-dried technique (tem-
perature 100°C and flow rate 1.0 ml/min- 1
)to give a brown powder, or by using a
rotatory evaporator to give a dark brown crude residue.
Preparation of standard solutions. A 1,000 µg/ml- 1 stock solution of arbutin standard was
prepared in methanol. A series of each standard solution containing 0.5, 1.0, 3.0, 5.0,
10.0, and 30.0 µg/ml- 1 was prepared from the stock standard solution.
Preparation of sample solutions. Three sets of medicinal crude extracts (5 g) and cosmetic
samples (0.5 g) of each set were extracted under reflux with 100 ml of 75% methanol
for 30 min and filtered. The filtrate was evaporated to about 12 ml and transferred into
a 250-ml separator followed by addition of 50 ml of water. The mixture was then
extracted with ether (2 x 30 ml). The combined aqueous layer was extracted with ethyl
acetate (3 x 50 ml). The combined ethyl acetate extract was then evaporated to dryness
and dissolved in 10 ml of methanol.
Preliminary investigation. A preliminary investigation was carried out to separate some
chemical constituents by TLC. The crude extract was extracted with 75% methanol
under reflux for 30 min and then filtered. The filtrate was evaporated to about 12 ml and
transferred to a 250-ml separating funnel together with 50 ml of water. This solution
was extracted three times with 50 ml of ethyl acetate, and the combined ethyl acetate
extracts were evaporated to dryness and the residues dissolved in 10% methanol. The
sample solution and the standard solutions were separated on a silica gel GF2
54 (20 x 20
cm) glass plate, using ethyl acetate:methanol (9: 1) as a developing solvent. The crude
extract gave five well-defined spots. The Rf value of each spot was exactly the same as
that obtained from each spot of standard.
Optimization of experimental conditions for RP-HPLC. RP-HPLC was performed under
isocratic conditions. All experimental conditions were optimized by means of a univari-
ate method as follows:
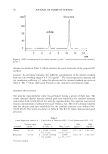
Analytical wavelength. Optimum absorbance of each standard solution was determined
by injection of the same amount of mixed standard solutions (5 .0 µg/ml- 1 )at different
wavelengths from 200 nm to 400 nm. The mobile phase was a mixture consisting of
water:methanol (80:20 v/v) with a flow rate of 1.0 ml/min- 1
.As the optimum to obtain
the best sensitivity,
"-max was chosen.
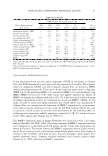
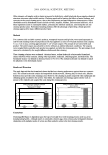
Mobile phase. Various solvent systems were tested as the mobile phase for the separation
of arbutin in the samples, e.g., water:acetonitrile:0.1 M hydrochloric acid (94:5: 1, v/v/v),
water:methanol:0.1 M hydrochloric acid (89: 10: 1, v/v/v), and methanol: 100 mM phos-
phate buffer, pH 2.1 (10:90 v/v).
PROCEDURES
Sample preparation (skin-whitening cream). About 0.5 g of each whitening cream was
accurately weighed and transferred into three separate 25-ml volumetric flasks and
dissolved in methanol. To each flask 50 µg/ml- 1 of resorcinol was added as an internal
standard. The solution was sonicated vigorously for 30 min, centrifuged at 4000 rpm for
30 min, and filtered on a Millipore membrane (0.45 µm) to obtain a transparent
solution. The supernatant liquid was used for chromatographic analysis.
Extraction of medicinal plants. The dried medicinal plants were powdered. Then 6 kg of
the powder was extracted with two successive portions of 5 .0 1 of de-ionized water and
methanol. They were shaken in a wrist-action shaker for five hours and filtered. Then the
solvent of the filtrate could be removed either by using a spray-dried technique (tem-
perature 100°C and flow rate 1.0 ml/min- 1
)to give a brown powder, or by using a
rotatory evaporator to give a dark brown crude residue.
Preparation of standard solutions. A 1,000 µg/ml- 1 stock solution of arbutin standard was
prepared in methanol. A series of each standard solution containing 0.5, 1.0, 3.0, 5.0,
10.0, and 30.0 µg/ml- 1 was prepared from the stock standard solution.
Preparation of sample solutions. Three sets of medicinal crude extracts (5 g) and cosmetic
samples (0.5 g) of each set were extracted under reflux with 100 ml of 75% methanol
for 30 min and filtered. The filtrate was evaporated to about 12 ml and transferred into
a 250-ml separator followed by addition of 50 ml of water. The mixture was then
extracted with ether (2 x 30 ml). The combined aqueous layer was extracted with ethyl
acetate (3 x 50 ml). The combined ethyl acetate extract was then evaporated to dryness
and dissolved in 10 ml of methanol.
Preliminary investigation. A preliminary investigation was carried out to separate some
chemical constituents by TLC. The crude extract was extracted with 75% methanol
under reflux for 30 min and then filtered. The filtrate was evaporated to about 12 ml and
transferred to a 250-ml separating funnel together with 50 ml of water. This solution
was extracted three times with 50 ml of ethyl acetate, and the combined ethyl acetate
extracts were evaporated to dryness and the residues dissolved in 10% methanol. The
sample solution and the standard solutions were separated on a silica gel GF2
54 (20 x 20
cm) glass plate, using ethyl acetate:methanol (9: 1) as a developing solvent. The crude
extract gave five well-defined spots. The Rf value of each spot was exactly the same as
that obtained from each spot of standard.
Optimization of experimental conditions for RP-HPLC. RP-HPLC was performed under
isocratic conditions. All experimental conditions were optimized by means of a univari-
ate method as follows:
Analytical wavelength. Optimum absorbance of each standard solution was determined
by injection of the same amount of mixed standard solutions (5 .0 µg/ml- 1 )at different
wavelengths from 200 nm to 400 nm. The mobile phase was a mixture consisting of
water:methanol (80:20 v/v) with a flow rate of 1.0 ml/min- 1
.As the optimum to obtain
the best sensitivity,
"-max was chosen.
Mobile phase. Various solvent systems were tested as the mobile phase for the separation
of arbutin in the samples, e.g., water:acetonitrile:0.1 M hydrochloric acid (94:5: 1, v/v/v),
water:methanol:0.1 M hydrochloric acid (89: 10: 1, v/v/v), and methanol: 100 mM phos-
phate buffer, pH 2.1 (10:90 v/v).