40 JOURNAL OF COSMETIC SCIENCE
mAU
l l
j
120:i r
801
l
40
0
2 4
Resorcinol
Arbutin
6 8 10 12 14
mm
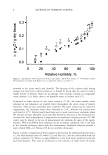
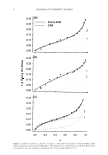
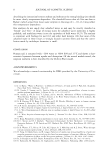
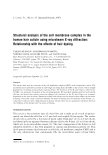
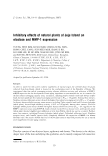
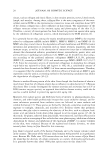
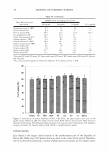
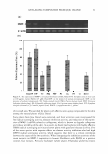
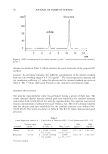
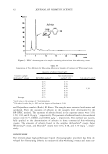
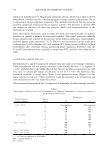
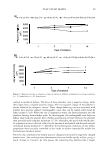
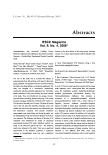
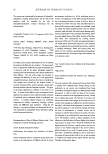
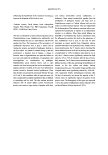
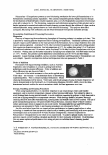
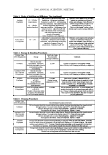
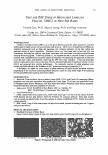
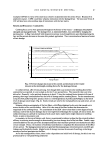
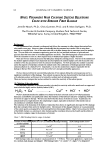
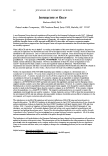
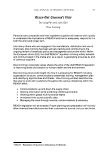
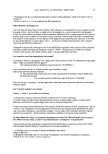
Figure 2. HPLC chromatogram of the arbutin standard (5 µg/ml- 1 )and the resorcinol internal standard (5
µg/ml- 1 ).
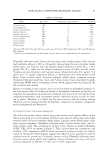
obtained as shown in Table I, which indicates the good sensitivity of the proposed LC
method.
Linearity. To determine linearity, five different concentrations of the arbutin standard
were used in a working range of 0. 5-3 0. 0 µg/ ml -1
• The linear regression equations and
the correlation coefficient (r2) values for arbutin and the internal standard are given in
Table I. The r2 values show good linearity in the examined concentration range.
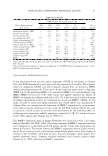
PRECISION AND ACCURACY
The intraday reproducibility study was performed during a period of three days. The
results obtained showed that the arbutin peak area variabilities for standard solutions
were within 0.00-0.02% R.S.D. For interday reproducibility, five replicate injections of
various concentrations of arbutin were made within a day. The results obtained showed
that the arbutin peak area variabilities for the standard solutions were within 0.00-
0.02% R.S.D. The results are shown in Table II. The R.S.D. values demonstrated good
precision.
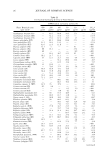
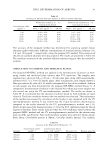
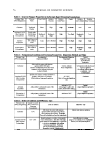
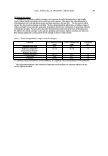
Table I
Linear Regression Analysis (n =3) and Limits of Detection (S/N =3) and Quantitation (SIN =10)
Linearity range Equation r 2 1OD LOQ
Standard (�1g/ml- 1
)Y =SX +C Mean (±S.D.) (µg/ml- ')(µg/ml- 1
)
Arbutin 0.5-30 Y =132.84 (±0.36)X 0.9999 5.07
X 10-5 1.01
X 10-2
-9.32 (± 1.23) (±5.77
X 10-S)
Resorcinol *0.5-30 Y =257.03 (±0.9l)X 0.9999 5.04
X 10-5 1.00
X 10-2
+7 .34 (±0.04) (± 1.49
X 10- 8
)*Internal standard.
mAU
l l
j
120:i r
801
l
40
0
2 4
Resorcinol
Arbutin
6 8 10 12 14
mm
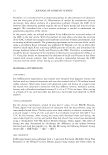
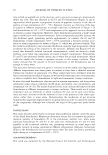
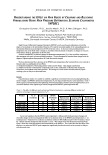
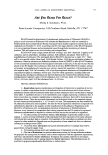
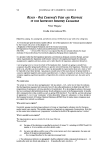
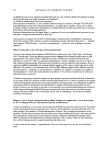
Figure 2. HPLC chromatogram of the arbutin standard (5 µg/ml- 1 )and the resorcinol internal standard (5
µg/ml- 1 ).
obtained as shown in Table I, which indicates the good sensitivity of the proposed LC
method.
Linearity. To determine linearity, five different concentrations of the arbutin standard
were used in a working range of 0. 5-3 0. 0 µg/ ml -1
• The linear regression equations and
the correlation coefficient (r2) values for arbutin and the internal standard are given in
Table I. The r2 values show good linearity in the examined concentration range.
PRECISION AND ACCURACY
The intraday reproducibility study was performed during a period of three days. The
results obtained showed that the arbutin peak area variabilities for standard solutions
were within 0.00-0.02% R.S.D. For interday reproducibility, five replicate injections of
various concentrations of arbutin were made within a day. The results obtained showed
that the arbutin peak area variabilities for the standard solutions were within 0.00-
0.02% R.S.D. The results are shown in Table II. The R.S.D. values demonstrated good
precision.
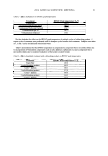
Table I
Linear Regression Analysis (n =3) and Limits of Detection (S/N =3) and Quantitation (SIN =10)
Linearity range Equation r 2 1OD LOQ
Standard (�1g/ml- 1
)Y =SX +C Mean (±S.D.) (µg/ml- ')(µg/ml- 1
)
Arbutin 0.5-30 Y =132.84 (±0.36)X 0.9999 5.07
X 10-5 1.01
X 10-2
-9.32 (± 1.23) (±5.77
X 10-S)
Resorcinol *0.5-30 Y =257.03 (±0.9l)X 0.9999 5.04
X 10-5 1.00
X 10-2
+7 .34 (±0.04) (± 1.49
X 10- 8
)*Internal standard.