0.8
Q)
:::J
UJ -� 0.6
�
"'C
C) ......0.4
0
N I
C) 0.2
-:::
0.0
0
THE HUMAN NAIL: SORPTION ISOTHERMS
� □ ◊. ·�---·· ...
◊ � .....................
······•··········
·· · · ··
20 40 60
Relative Humidity, %,
80
5
100
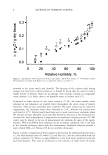
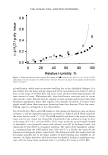
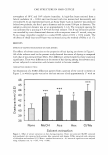
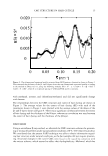
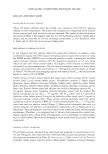
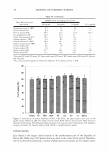
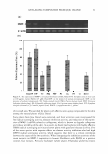
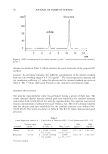
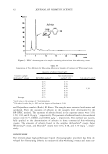
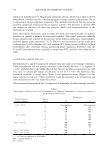
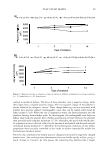
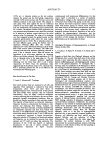
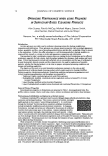
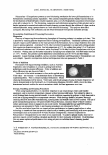
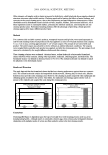
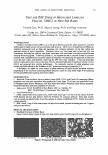
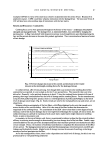
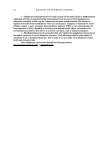
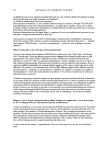
Figure 2. Mean equilibrium water sorption for human nail (e), horn (9) (6), hair (31) (◊ ),wool (31) (□),
and human stratum corneum (21) (dotted line). The nail data are the mean of the uptake and desorption
values in Figure 1.
in hard keratin, which restricts excessive swelling due to the disulphide linkages. It is
also evident that the shape and the magnitude of the nail isotherm are closest to that of
horn. In the range of 30-60% RH, nail, horn, wool, and hair sorbed approximately the
same amount of water. Phylogenetically, these hard keratin structures arise in tissues
that provide a static function and are exposed to more pressure and friction than other
keratinous membranes hence they require a fair amount of rigidity. Excessive water
uptake would soften these structures, detracting from their function. Their low water-
holding capacity corresponds to this requirement.
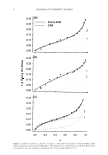
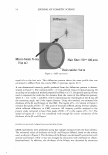
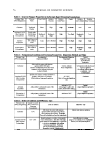
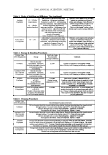
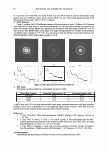
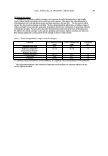
Fits of the D'Arcy-Watt and GAB models to the uptake and desorption data are shown
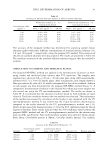
in Figure 3, and the regression parameters are shown in Tables I and II. Both models fit
the entire data set with r2 0.99. The GAB model fit the data in the region of higher
water activity very closely but missed the initial bend of the isotherm at water activity
in the range of 0.3-0.5. At lower RH (25%), water molecules are principally bonded
to hydrophilic sites [primarily amino and carbonyl sites (8)} by hydrogen bonds this
region may be described by a Langmuir isotherm. The values of the monolayer volume,
vmJ estimated from the GAB model, were 0.06 and 0.11 g H
2 O/g dry tissue for the
sorption and desorption phases, respectively. The desorption value was higher than that
for uptake, possibly due to the larger number of water-binding sites available on de-
sorption. At higher humidity, additional water is adsorbed, leading ro multilayer sorp-
tion, with the tissue being saturated with 0.3 g H
2
O/g dry tissue at 100% RH.
Q)
:::J
UJ -� 0.6
�
"'C
C) ......0.4
0
N I
C) 0.2
-:::
0.0
0
THE HUMAN NAIL: SORPTION ISOTHERMS
� □ ◊. ·�---·· ...
◊ � .....................
······•··········
·· · · ··
20 40 60
Relative Humidity, %,
80
5
100
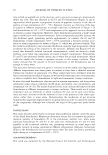
Figure 2. Mean equilibrium water sorption for human nail (e), horn (9) (6), hair (31) (◊ ),wool (31) (□),
and human stratum corneum (21) (dotted line). The nail data are the mean of the uptake and desorption
values in Figure 1.
in hard keratin, which restricts excessive swelling due to the disulphide linkages. It is
also evident that the shape and the magnitude of the nail isotherm are closest to that of
horn. In the range of 30-60% RH, nail, horn, wool, and hair sorbed approximately the
same amount of water. Phylogenetically, these hard keratin structures arise in tissues
that provide a static function and are exposed to more pressure and friction than other
keratinous membranes hence they require a fair amount of rigidity. Excessive water
uptake would soften these structures, detracting from their function. Their low water-
holding capacity corresponds to this requirement.
Fits of the D'Arcy-Watt and GAB models to the uptake and desorption data are shown
in Figure 3, and the regression parameters are shown in Tables I and II. Both models fit
the entire data set with r2 0.99. The GAB model fit the data in the region of higher
water activity very closely but missed the initial bend of the isotherm at water activity
in the range of 0.3-0.5. At lower RH (25%), water molecules are principally bonded
to hydrophilic sites [primarily amino and carbonyl sites (8)} by hydrogen bonds this
region may be described by a Langmuir isotherm. The values of the monolayer volume,
vmJ estimated from the GAB model, were 0.06 and 0.11 g H
2 O/g dry tissue for the
sorption and desorption phases, respectively. The desorption value was higher than that
for uptake, possibly due to the larger number of water-binding sites available on de-
sorption. At higher humidity, additional water is adsorbed, leading ro multilayer sorp-
tion, with the tissue being saturated with 0.3 g H
2
O/g dry tissue at 100% RH.