DETERMINATION OF LEAD IN LIPSTICKS 161 APPARATUS Lipsticks were digested in CEM EasyPrepTM vessels on a CEM MARS microwave diges- tion system (CEM Corporation, Matthews, NC). The analytical solutions were stored in metal-free grade polypropylene centrifuge tubes, with additional acid cleaning to remove contamination (50 ml, Tyco Healthcare Group, Mansfi eld, MA, and 15 ml, VWR Inter- national, Radnor, PA). Lead analyses were performed on a Perkin Elmer Elan 6000 with DRC II ICP-MS (Perkin Elmer, Shelton, CT). REAGENTS High purity (18 MΩ) deionized water was used throughout. Lead standard (0, 0.01, 0.02, 0.04, 0.08, 1.25, 2.50, 5.00, 12.50, and 25.00 μg Pb/l), lead stock (0.100 and 1.00 mg Pb/l), and platinum internal standard (0.4 mg Pt/l) solutions were prepared from com- mercial ICP-MS grade single-element analyte solutions (CPI International, Santa Rosa, CA). Trace metal grade nitric acid (EMD Chemicals, Gibbstown, NJ) was used for sam- ple, stock, and standard solutions. Hydrofl uoric acid (Fisher Scientifi c, Pittsburgh, PA) was used in the sample solutions. Boric acid (Puratronic grade, Alfa Aesar, Ward Hill, MA) was used to prepare 4% boric acid solution. A 0.100 mg Pb/kg in oil stock solution was prepared from 1000 mg Pb/kg organo-metallic standard serially diluted to 10.00 and then to 0.100 mg Pb/kg with base oil 20 (organo-metallic lead standard and base oil, both from Spex CertiPrep, Inc., Metuchen, NJ). Nitric acid (1%, v/v) was used for preparing calibration standards and analytical solutions. Water standard reference material NIST SRM 1643e (National Institute of Standards and Technology, Gaithersburg, MD) con- taining 19.15 ± 0.20 mg Pb/kg, diluted 1/10 with 1% nitric acid, was used as a secondary standard to check ICP-MS performance. METHOD The protocol was consistent with the FDA’s validated method (1), and continued reliability of the results was verifi ed by using specifi c quality control procedures, as follows: • Weigh and transfer 0.3 ± 0.1 g of lipstick to a digestion vessel liner. • Add 7 ml of nitric acid and 2 ml of hydrofl uoric acid to the lipstick in the liner. • Seal and heat the vessels in the microwave digestion oven. Ramp the temperature over 20 minutes to 130°C and hold for three minutes, then continue to ramp the temperature over 20 minutes to 200°C and hold for 30 minutes. Allow the samples to cool to less than 50°C. • Vent and open the vessels in a fume exhaust hood. • Add 30 ml of 4% boric acid solution to each. • Reseal and heat the vessels in the microwave digestion system. Ramp the temperature over 20 minutes to 170°C and hold for ten minutes. Cool, vent, and open the vessels in a fume exhaust hood. • Quantitatively transfer the contents of the digestion vessels to 50-ml centrifuge tubes and dilute to 50 ± 0.25 ml with water. • Include two method blanks in each digestion batch to assess contamination.

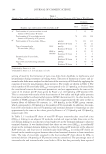
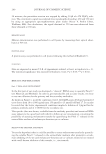
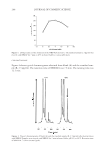
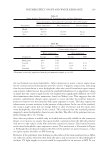
JOURNAL OF COSMETIC SCIENCE 162 • Include one method blank fortifi ed with organic lead in oil (low-level organic lead fortifi cation solution) in each digestion batch. • Include one method blank fortifi ed with inorganic lead (low-level inorganic lead fortifi cation solution) in each digestion batch. • Prepare each lipstick sample in duplicate. ICP-MS ANALYSIS Internal standardization was performed using a 195 Pt isotope. The analytical run began with a seven-point standard curve between 0.010 μg Pb/l and 25 μg Pb/l, with con- tinuing calibration verifi cation standards run every 15 samples. The daily calibration standard curves were calculated using linear regression (ELAN software). The instru- ment was tuned in the “normal” (no gas) mode to meet specifi cations for sensitivity, oxide ratio, and doubly charged ratio as detailed by Perkin Elmer. Analytical solutions and standards were merged online with the internal standard solution via a T-fi tting before the nebulizer. The method was set up to quantify lead using a sum of the iso- topes 206,207,208 Pb to account for isotopic variation between samples and standards. The 195 Pt isotope was measured for internal standardization. Prepared samples (analytical solu- tions) were analyzed using a dilution of 1/20 in 1% (v/v) nitric acid relative to calibra- tion standards using linear regression (y = ax + blank). No analytical solutions had internal standard signals that differed by more than 40% relative to the calibration blank. QUALITY CONTROL The correlation coeffi cient for the standard curve was greater than 0.997 in all cases. Calibration was verifi ed by analyzing a calibration blank and two quality control (QC) solutions (secondary inorganic lead stock solution and lead in water reference solution) immediately after calibration and after every 15 analytical solutions. The QC solution recovery was between 90% and 110%. One analytical solution from each digestion batch was diluted 1/40 with 1% nitric acid and compared with the same solution diluted 1/10 to evaluate matrix effects. Any analytical solutions with lead levels above the highest standard were further diluted to within the calibration range to determine the lead concentration. STATISTICAL COMPARISON OF MEAN LEAD VALUES AMONG COMPANIES Seven parent companies with 18 or more lipsticks from each company made up nearly 80% of the samples (319 out of 400 lipsticks). These seven companies (number of lip- sticks) were Companies A (77), C (21), D (41), E (20), F (18), G (117), and H (25). To test for signifi cant differences among companies, an analysis of variance (ANOVA) was per- formed using the mean lead value data. The log-transformed data were used in the ANOVA because they were more normally distributed. Since the overall ANOVA test was signifi cant at p ≤ 0.05, we performed a
Purchased for the exclusive use of nofirst nolast (unknown)
From: SCC Media Library & Resource Center (library.scconline.org)