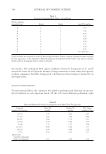
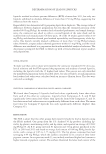
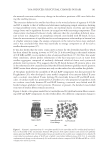
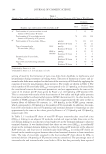
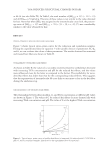
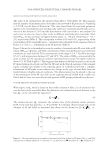
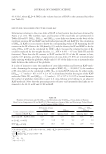
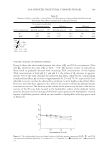
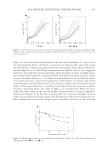
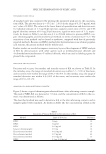
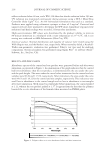
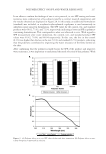
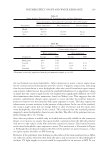
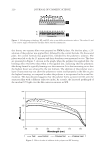
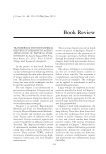
HPLC DETERMINATION OF KOJIC ACID 209 STANDARD CURVE OF KA A standard curve was constructed by plotting the integrated peak area vs. the concentra- tion of KA. The plot was linear (y = 95.24x + 2.043) in the range of 0.25–5 μg/ml, with an r2 value of 0.9982. The values of the lower limits of quantifi cation and detection were 0.2 (absolute amount of 1.3 ng/20 μl injection signal-to-noise ratio of 10:1) and 0.06 μg/ml (absolute amount of 0.4 ng/20 μl injection signal-to-noise ratio of 3:1), respec- tively. As shown in Table I, our data was 4.3 to 20-fold inferior to previous HPLC, ion- pair chromatography, and electrochemical methods in terms of sensitivity (3–5,7). The sensitivity of our method can be classed as moderate, compared with that of previously reported methods. Because our HPLC method after derivatization is one of most popular- ized systems, the present method will be widely used. Further studies are needed to improve sensitivity by novel development of HPLC analysis of KA by derivatization with other agents such as methoxybenzoyl chloride and 4-(dimethylamino)azobenzene-4′-sulfonyl chloride, which are used as labeling agents for phenol-like compounds. PRECISION AND ACCURACY Precision and accuracy for intraday and interday assays of KA are shown in Table II. In the intraday assay, the range of standard deviation was within 3.7–7.6% of the mean, and recoveries were within the range of 89.2–102.4%. In the interday assay, the range of standard deviation was within 4.9–9.6% of the mean, and recoveries were within the range of 87.6–101.2%. ANALYSIS OF A SKIN-WHITENING COSMETIC Figure 5 shows a typical chromatogram obtained from a skin-whitening cosmetic sample. The peak of NBD-KA was detected at 7.8 min, and the concentration of KA in the cos- metic was determined as follows. The described method was used to determine KA in the skin-whitening cosmetic and in samples spiked with standards. As shown in Table III, the concentration of KA in the Table I Sensitivity of Various Methods for Determination of KA Method Limit of detection Reference HPLC 5 μg/g (1) HPLC 3 μg/ml (2) HPLC 0.01 μg/ml (3) Ion-pair chromatography 0.02 ng (4) Electrochemical method 0.024 μg/ml (5) Electrochemical method 0.07 μg/ml (6) Electrochemical method 0.014 μg/ml (7) HPLC 0.4 ng 0.06 μg/ml This paper

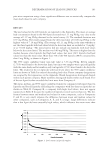
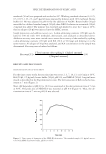
JOURNAL OF COSMETIC SCIENCE 210 Figure 5. Typical chromatogram of a skin-whitening cosmetic sample (0.15 ml/100 ml in 10% methanol) after derivatization with NBD-F. The sample was reacted with NBD-F for 7 min in borate buffer, pH 9.0, at 40°C. Retention time of NBD-KA: 7.8 min (arrowed peak). skin-whitening cosmetic was found to be 237 ± 14 μg/ml (range: 219–255 μg/ml). Recovery of spiked KA from the cosmetic was 90.2 ± 4.9% (range: 83.4% to 98.1%). The cosmetic contained KA at the concentration of 4.27 ± 0.25 mg per package. KA will be detected using our system when the cosmetic contains KA at more than 0.72 mg per package (more than 40 μg/ml). Table II Intra- and Interday Assay Reproducibility for Determination of KA KA (μg/ml) Measured (μg/ml, mean ± S.D., n = 5) C.V. (%) Recovery (%) Intraday assay 0.25 0.223 ± 0.017 7.6 89.2 1.25 1.18 ± 0.07 5.9 94.4 5 5.12 ± 0.19 3.7 102.4 Interday assay 0.25 0.219 ± 0.021 9.6 87.6 1.25 1.16 ± 0.10 8.6 92.8 5 5.06 ± 0.25 4.9 101.2 C.V.: Coeffi cient of variation.
Purchased for the exclusive use of nofirst nolast (unknown)
From: SCC Media Library & Resource Center (library.scconline.org)