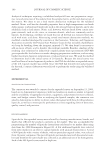
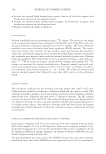
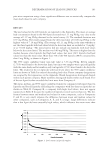
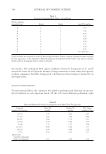
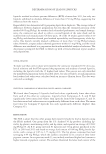
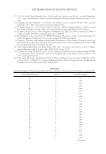
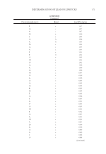
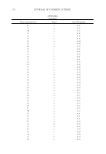
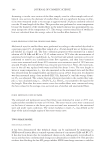
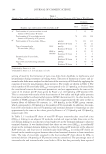
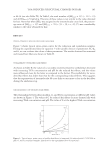
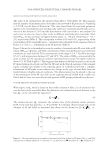
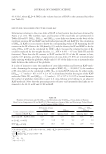
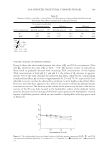
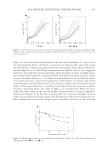
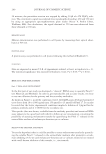
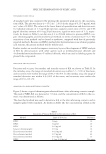
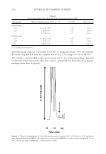
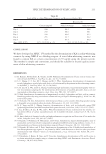
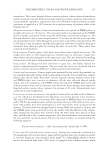
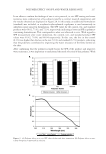
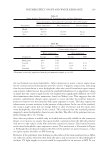
DETERMINATION OF LEAD IN LIPSTICKS 163 pair-wise comparison using a least signifi cant difference test to statistically compare the mean lead values for each company. RESULTS The lead values for the 400 lipsticks are reported in the Appendix. The mean or average lead concentration found in the 400 lipsticks tested was 1.11 mg Pb/kg, very close to the average of 1.07 mg Pb/kg obtained in the initial survey (1). The standard deviation was 0.97 mg Pb/kg. The results ranged from the detection limit of 0.026 mg Pb/kg to the highest value of 7.19 mg Pb/kg. (The average of 1.11 mg Pb/kg is the same whether or not the three lipsticks with lead values below the detection limit are included as “0 mg/kg” or as “0.026 mg/kg.” The initial survey did not include any lipsticks with lead values below the detection limit.) The median was 0.89 mg Pb/kg. The mean is higher than the median because a few lipsticks had high lead values, but most (247) lipsticks had lead values less than the mean value. More than 350 of the 400 lipsticks (88%) contained less than 2 mg Pb/kg, as shown in Figure 1. The 99% upper confi dence limit (one-tail) value is 3.36 mg Pb/kg. Eleven samples (2.75%) were found to be above that limit, but since two samples were a pair of lipsticks with the same shade and lot number, only ten lipsticks (2.5%) were found to be above the limit. The results for the ten lipsticks with lead levels above the 99% upper confi dence limit are shown in Table I in order of descending lead value. Parent company designations are assigned by fi rst appearance in the Appendix. Brand designations distinguish brands within each parent company. Shade numbers distinguish shades within each brand. Five of the ten lipsticks that exceeded this limit were from Company A. The mean, median, and 99% upper confi dence limits for companies with more than ten lipsticks and for all lipsticks (including the companies with less than ten lipsticks) are shown in Table II. Company B, a company with high lead values, does not appear separately in Table II because the number of lipsticks tested was less than ten. The dif- ference between mean and median lead values for some companies, such as Companies C and D, is very small, whereas the difference between mean and median values for other companies, such as Companies A, E, and F, is large. Large differences indicate that a few lipsticks have unusually high values, which infl uence the mean more than Figure 1. Lead content in lipstick samples.

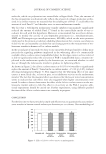
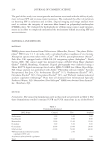
JOURNAL OF COSMETIC SCIENCE 164 the median. The individual 99% upper confi dence limits for Companies A, C, and F exceed the limit for all lipsticks because of large variations in lead values for lipsticks in those companies. Notably, Company A’s distribution of lead values is skewed by its fi ve high values. QUALITY CONTROL RESULTS To assess matrix effects, the contractor was asked to perform serial dilutions on one ana- lytical solution in each digestion batch. Of the 100 serial dilutions performed, eight Table II Mean and Median Pb Values for Companies with More Than Ten Lipsticks Company (number of lipsticks) Mean Pb mg/kg Median Pb mg/kg 99% Upper confi dence limit A (77) 1.25 0.93 4.35 C (21) 2.01 2.00 5.00 D (41) 1.68 1.70 3.31 E (20) 1.04 0.58 3.25 F (18) 1.47 1.07 4.48 G (117) 0.66 0.56 1.77 H (25) 1.00 0.86 2.14 I (11) 0.78 0.70 1.47 All lipsticks (includes companies with 10 lipsticks) 1.11 0.89 3.36 Table I Lipsticks Containing More Than 3.36 mg Pb/kg Parent company (manufacturer) Brand Shade Lead (Pb) mg/kg A a 1 7.19 A b 1 7.00 B a 1 4.93 C a 1 4.92 B a 2 4.89 A b 2 4.45 A b 3 4.41 C b 1 4.28 A a 2 4.23 F a 1 4.12 and 4.06 Lipstick results are reported in order of descending lead value. Parent company designations were assigned by fi rst appearance in the Appendix. Brand designations distinguish brands within each parent company. Shade numbers distinguish shades within each brand.
Purchased for the exclusive use of nofirst nolast (unknown)
From: SCC Media Library & Resource Center (library.scconline.org)