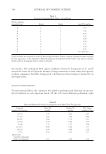
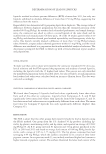
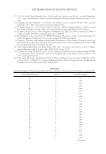
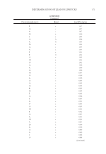
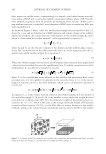
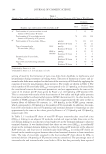
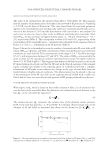
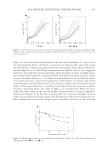
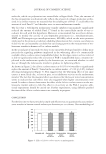
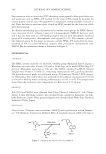
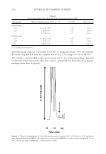
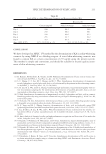
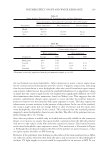
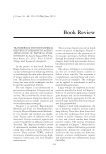
POLYMER EFFECT ON SPF AND WATER RESISTANCE 219 the test formula was more hydrophilic. After immersion in water, contact angle values for the control and test formulations were 68.1 and 71.9 degrees, respectively, indicating that the test formulation is more hydrophobic than the control formulation upon immer- sion in water, which was not the case for the standard formulation. It is important to keep in mind that the contact angle for the test formula was signifi cantly different (p0.05) after immersion than before immersion, based on Tukey’s test. This suggests that the polymer conformation changes upon exposure to water and that the polymer formed a protective barrier over the sunscreen fi lm upon exposure to water. This may explain the enhancement in water resistance in the presence of the polymer. In the case of the standard, the contact angle values did not change before or after immersion and the values were more hydrophobic than those of the control. This indicates that the standard polymer imparted a more hydrophobic character onto the fi lm. The effect of the polymer was con- fi rmed during the in vivo testing. Since the test polymer is soluble only in alcohol and not really soluble in oils (sunscreen phase), it is intuitive to assume that upon alcohol evaporation from the fi lm the polymer will move to the surface of the fi lm and form a protective barrier. This barrier becomes much more hydrophobic upon exposure to water. This mechanism is illustrated in Figure 4. Although this mechanism explains the effect of the polymer on water resistance, it does not quite explain the effect on SPF boosting. However, if the polymeric layer forming on the surface of the sunscreen layer has a differ- ent refractive index, refraction may then take place and an increase in the pathlength of incident UV light might occur and would be responsible for an increase in SPF. To test Table II Image Analysis Performed on All Treatments before and after Immersion Treatments Grayscale analysis—Area under the curve from 150 to 250 (pixels) Before immersion After immersion Percent change Blank 480,374 Control 60,558 116,539 92.44 Test 283,793 331,263 16.73 Table III Contact Angles Measured on Sunscreen Films on PMMA Plates before and after Immersion Treatments Contact angles (degrees) Before immersion After immersion Average STD Average STD Blank plate 68.9 3.46 Control 67.1 0.85 68.13 0.74 Test 62.7 0.53 71.9* 0.40 Standard 74.87 0.52 75.8 0.51 *Treatment statistically signifi cant from the pre-immersion sample at p 0.05.

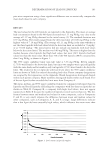
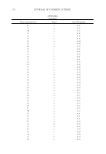
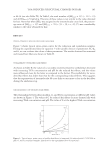
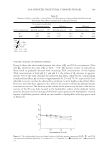
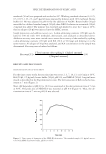
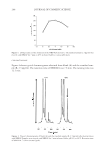
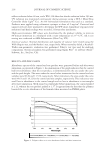
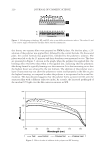
JOURNAL OF COSMETIC SCIENCE 220 this theory, two separate fi lms were prepared on PMMA plates. On the fi rst plate, a 2% solution of the polymer was applied fi rst, followed by the control formula. On the second plate, the control formula was applied fi rst, followed by the polymeric solution. The plates were left to dry for 15 minutes and their absorbance was measured in vitro. The data are presented in Figure 5. As seen in the graph, when the polymer was applied fi rst, the boosting effect was lower than when it was applied last, indicating that the polymeric fi lm being formed is typically forming over the sunscreen. It is also interesting to see that the highest boost was achieved by the test formula. The addition of the polymer over a layer of sunscreen may not allow the polymer to orient itself properly in the fi lm to give the highest boosting, as compared to when the polymer is incorporated in the actual for- mulation. The data obtained suggests that the polymer forms a protective fi lm over the sunscreen fi lm with a different refractive index. As a result, the increased pathlength of the incident UV light over the fi lm causes an increase in SPF. Figure 4. Self-adapting technology. RF1 and RF2 refer to two different refractive indices. The values 63 and 72 are contact angles obtained for the fi lms before and after immersion. Figure 5. Effect of order of addition of the polymer on SPF boosting.
Purchased for the exclusive use of nofirst nolast (unknown)
From: SCC Media Library & Resource Center (library.scconline.org)