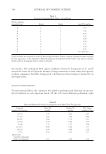
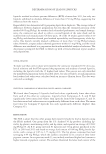
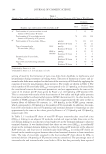
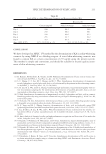
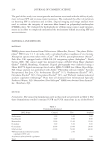
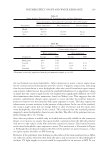
JOURNAL OF COSMETIC SCIENCE 188 43.4:56.6, where c I 0.566 d0 is the volume fraction of KAP in the untreated hair fi ber (see Table II). RESULTS FOR CROSS-LINKED STRUCTURE OF HAIR KAP Information relating to the cross-links of KAP in hair keratin has also been obtained by Naito et al. (15). The number, type, and location of SS cross-links are summarized in Tables III and IV. [SS]tot, [SS]inter, and [SS]intra cross-links are shown on the basis of the total hair proteins (IF and KAP) and individual proteins IF and KAP. For the calculation of [SS]tot in KAP, it is necessary to know the corresponding value of IF. Assuming the SS content in the IF of hair to be 200 μmol/g (33) and the density for IF and KAP to be the same, [SS]tot in IF can be calculated by Ic 200 1 d0 , because the volume fraction of Ic d0 could be replaced by the weight fraction, i.e., 200 × 0.435 = 87 (see Table III and the footnotes). Note that the SS content in KAP reaches 86.2% of the SS content in hair, namely, 627 μmol/g, and that a large portion of cross-links (75.8%) are intramolecular links existing within the globules, while only 10.4% of the links occur as intermolecular links between the surfaces of the globules. It is also of interest to note the numbers of cross-links within and between KAP mole- cules. Assuming the average molecular weight of KAP, Mave = 20,000 (15), the number of SS cross-links can be calculated as [SS] · Mave in moles/KAP molecule. In other words, [SS]intra = 17 moles (= 851 × 106 × 2 × 104) is distributed within the region of the KAP molecule (Table IV), and [SS]inter = 2.3 moles (= 115 × 106 × 2 × 104) is located between the surface of globular molecules to give 4.6 cross-linking sites linking to an adjacent KAP molecule. Note that the percentage ratios of inter- and intramolecular links are es- timated to be 66:34 in IF and 12:88 in KAP. Table III Number of Intermolecular SS ([SS]inter) and Intramolecular SS ([SS]intra) Cross-Links in Human Hair Cortex Components, IF and KAP (15): Micromole per Gram of Hair and Percentage Values Based on SS Content of Hair ([SS]tot) Cortex components (volume fraction of KAP, c Id0 ) SS Content of hair, [SS]tot [SS]inter [SS]intra (= [SS]tot − [SS]inter) (μmol/g·hair) (%) (μmol/g·hair) (%) (μmol/g·hair) (%) Hair total (IF + KAP) (1.000) 627 100 123 19.6 504 80.4 IF c I 1 0.435 d0 87a 13.8 58c 9.2 29e 4.6 KAP c I 0.565 d0 540b 86.2 65d 10.4 475f 75.8 a Calculation of [SS]tot in IF: refer to the text, c I u 200 1 200 0.435 87 d0 . b 627 – 87 = 540. c c I u 6 10 2 1 132 0.435 58. c d0 M d Ref. 15. e 87 – 58 = 29. f 540 – 65 = 475.

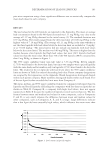
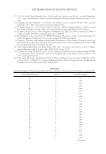
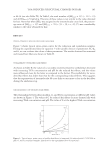
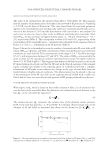
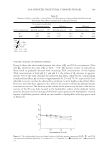
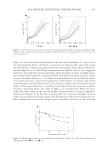
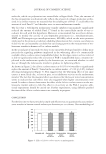
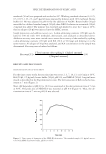
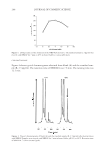
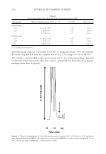
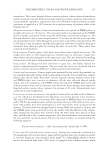
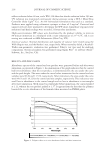
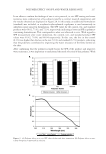
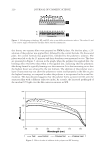
TGA-INDUCED STRUCTURAL CHANGES IN HAIR 189 VOLUME CHANGE OF MATRIX DOMAIN Figure 6 shows the relationship between the values of Ic d and TGA concentration. Note that Ic d0 represents the value of Ic d at TGA = 0 M. The domain volume in reduced hair fi bers tends to gradually decrease with increasing TGA concentration. At the highest TGA concentration at both pH 8.7 and pH 9.3, the values of Ic d decrease to approxi- mately 70% of the value obtained for untreated hair fi bers, while for the corresponding reoxidized hair fi bers, Ic d recovers to approximately 91.2% and 79.5%, respectively. Con- siderable recovery can thus be observed by oxidation even for highly reduced hair fi bers. However, note that there appears to be a limit to the extent to which the globular matrix structure can recover. The decrease in the volume of the matrix may be due to the discon- nection of the SS cross-links located at the hydrophilic surface of the globular matrix proteins, because minimal cleavage of SS bonds is anticipated in the hydrophobic internal regions of globular proteins, which are inaccessible to hydrophilic reducing agents such as TGA (13). Table IV Number of [SS]inter and [SS]intra Cross-Links (15): Micromole per Gram of Individual Protein and Percentage Values Based on Individual Component Protein Cortex components SS content in individual component protein [SS]inter [SS]intra (μmol/g·protein) (%) (μmol/g·protein) (%) (μmol/g·protein) (%) IF 200a 100 132c 66.0 68e 34.0 KAP 966b 100 115d 12.0 851f 88.0 a Ref. 31. b c I 540 966. d0 c 106/2Mc = 132. d c I 65 115. d0 e 200 – 132 = 68. f 966 – 115 = 851. Figure 6. The relationships between volume fraction of globular matrix component (KAP), Ic d , and TGA concentration at different pH levels: ( ) reduced, 8.7 ( ) reduced, 9.3 ( ) reoxidized, 8.7 ( ) reoxidized, 9.3.
Purchased for the exclusive use of nofirst nolast (unknown)
From: SCC Media Library & Resource Center (library.scconline.org)