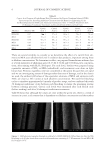
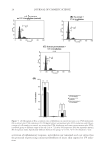
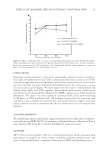
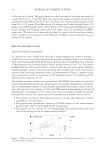
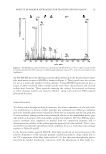
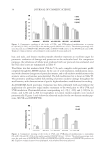
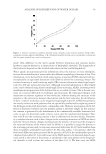
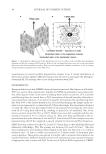
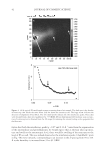
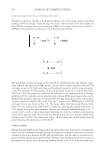
ANALYSIS OF DISTRIBUTION OF WATER IN HAIR 41 Attenuated total refl ectance (ATR) spectra were collected using Nicolet 6700 FTIR (Thermo Electron Corporation, Madison WI). The respective hair sample was placed on the ATR crystal. The spectral region from 900 to 4000 cm−1 was scanned. Spectra were analyzed using OMNIC software (Thermo Electron Corporation). RESULTS AND DISCUSSION INTERNAL STRUCTURE OF HAIR An example of the two-dimensional (2D) SANS pattern is shown in Fig. 4A. There is a key difference between Fig. 4A and Fig. 2 that was used for illustrating SANS. The dominant feature in Fig. 2 is attributed to the water in the interlamellar spaces, and is therefore aligned close to the fi ber-axis (off-meridional). In contrast, the dominant feature in Fig. 4A is attributed to the water in the channels along the fi ber-axis, and therefore occurs along the equator. We attribute the equatorial peak to the water in the spaces be- tween the IFs. Only half of the scattering pattern was obtained so as to record the second maximum. This second peak is signifi cantly weaker than the fi rst. A one-dimensional intensity scan (I vs. q) perpendicular to the fi ber-axes obtained from this image is plotted in Fig. 4B. Here, q is the scattering vector defi ned as q = 4π sinθ/λ (1) where λ is the wavelength of the neutrons (0.478 nm) and 2θ is the scattering angle. The spacing (d) between the scattering entities is calculated by Bragg’s equation d = 2π /q (2) The large scattering intensity, shown in dark (or red) color in Fig. 4A, arises from both the contrast due to D2O and due to the H–D exchange in the amine and amide groups in the hair structure. As shown using the IR data in a later section, the water taken up initially is strongly adsorbed, or even exchanged between the amine and amide functionality of the protein. The changes in the SANS intensity with the D2O concentration in hair can be understood by considering the changes in the contrast in the dry and the D2O-wet hair. Because hydro- gen has negative scattering length, there is a small negative contrast in the dry samples. As shown later in the section on CF hair, this negative contrast gives rise to a SANS interfer- ence peak even in dry samples. With infusion of some D2O, this contrast disappears at 6 %RHD, and the scattered intensity approaches zero. As the hair continues to absorb more D2O, contrast reaches large positive values and the intensity increases considerably. The interference peaks at q = 0.07 Å−1, the dumbbell-like pattern, and a weaker peak at 0.13 Å−1 are evidence of D2O diffusing into the matrix between the IFs, as well as into the IFs. The d-spacing corresponding to the peak at q = 0.07 Å−1 in Fig. 4B is 95 Å. This is consistent with 75 Å size of the IF (Fig. 1B). The second weak peak at q ~0.13 Å−1 (d = 48 Å) has contributions from the internal structure and from the lipids in keratinous tis- sue (12,13). Although it was claimed that the presence of this ring could be used to di- agnose breast cancer (14), this was later refuted (13). Consistent with these latter papers, our study data show that the 0.13 Å−1 peak is a composite of the second order of refl ection from IF assembly and from the lipids (to be published).

JOURNAL OF COSMETIC SCIENCE 42 Given that both the interference peaks (q ~0.07 and 0.13 Å−1) arise from the organization of the intermediate and protofi laments, we would expect that as the hair takes up mois- ture and swells at the macroscopic level, there would be swelling of the structures at the level of IFs as well. This was indeed observed as the interference peaks (“dumbbells” spots in Fig. 4A) move inwards, corresponding to an increase in the d-spacing from 95 to 101 Å as the humidity is increased from 32 to 92 %RH. Figure 4. (A) A typical 2D small-angle neutron scattering from a hair sample. The dark spot is the shadow of beam stop that blocks the main beam. Side bar shows the intensity scale. The large arrow indicates the direction of alignment of hair fi bers. The two small arrows indicate the two interference peaks. These data were obtained from a hair tress equilibrated at 75 %RHD (B) one-dimensional (1D) intensity scan as a func- tion of scattering vector obtained from the 2D image by summing the intensity along a slice perpendicular the fi ber-axis.
Purchased for the exclusive use of nofirst nolast (unknown)
From: SCC Media Library & Resource Center (library.scconline.org)