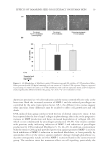
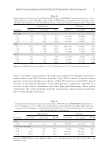
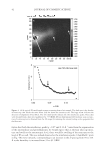
COMPARISON OF MONOETHANOLAMINE AND AMMONIA HAIR COLORANTS 5 are the arithmetic mean of all measurements of the four output readings for each bleach- ing cycle. Scanning electron microscope (SEM) analysis. SEM images were obtained using a Hitachi S- 3000N Scanning Electron Microscope with Oxford detector (Schaumburg, IL), at 500× magnifi cation. The hair tress was separated with a wooden applicator stick so that ca. 70 fi bers were lifted from the bulk of the tress. The fi bers were cut and laid onto a 15 mm × 15 mm SPI aluminum mount that was coated with an adhesive polymer. Loose hair fi bers were removed with tweezers and the ends of the fi bers were cut and affi xed to the disc with a carbon coating. The disc was allowed to dry for 5 min before placing it in the SEM sample chamber for analysis. SEM analysis was performed under low pressure (50 Pa) at 500× magnifi cation examining ca. 50 hair fi bers for cuticle damage. Preparation of samples for protein loss analysis. To a plastic weigh boat was added 3 g dyeless tint (0.82 M MEA or NH3 chassis) and 3 g of 20 volume Welloxon® developer. The two gels were mixed thoroughly before applying to a 1.5 g light brown hair tress. After uni- formly applying the mixture to the tress, the hair was placed in a covered weigh boat and incubated in a 30°C oven for 30 min. After completion of the incubation period, the hair was removed from the oven and rinsed for 2 min (37 ± 2°C water at a fl ow rate of 1.0 ± 0.2 gal/min), shampoo (0.15 ml per tress) was added and massaged into the hair for 30 s followed by a 30 s rinse (massaging the hair once in every 2 s). On completion, the hair was dried using a blow dryer on high heat/high air fl ow for 3 min (1 min per side + 1 min combing). Protein loss measurements. Protein loss analysis was performed on hair tresses after a single bleaching cycle using a modifi ed Lowry Assay against a porcine gelatin standard (8), for both the soluble and the insoluble fractions. Hair samples (0.2–0.3 g) were added to scintillation vials. Water was added at a ratio of 10 ml water per gram of hair. Samples were shaken for 1 h at 2500 rpm on a DVX-2500 Multi-2 Vortexer platform (Radnor, PA). For direct measurement of protein, samples were subjected to centrifugation at 14,000 rpm to separate the soluble/insoluble fractions. Pelleted material (insoluble) was solubilized in 3 M urea, 1 M NaOH, 0.06% 3-[(3-cholamidopropyl)dimethylammonio]- 1-propanesulfonate followed by sonication for 30 min in a Branson B300 sonicating water bath (34 kHz) (Danbury, CT). Four replicates were done per sample, and the reported values are the arithmetic mean of the four individual values. RESULTS AND DISCUSSION Given that MEA–peroxide is less effective for lightening hair than ammonia–peroxide at equimolar concentrations, we were interested in beginning to quantitate other trade-offs associated with its use. When hair is subjected to oxidative conditions and damage is expected, it is common to measure cysteic acid levels to quantitate that damage. How- ever, this can be somewhat misleading in cases in which other damage pathways exist, and in which cuticle is removed. Because our desire was to have a more complete idea of damage for Level 3 oxidation dye formulations containing MEA versus ammonia, we also used SEM as a damage measure, and for the potentially most extreme examples of high alkalizer concentration, we incorporated protein loss methods that have been successfully used for hair color product damage measurements (9).

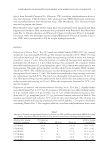
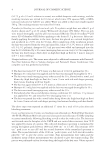
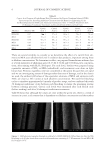
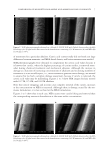
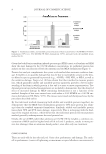
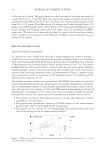
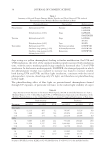
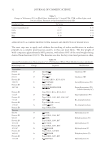
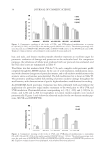
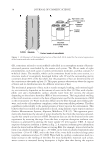
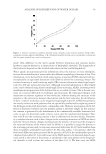
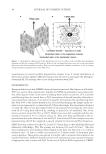
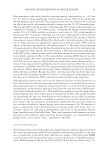
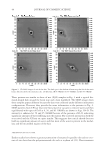
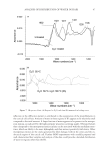
JOURNAL OF COSMETIC SCIENCE 6 There are several variables to consider as we determine the effect of a switch from am- monia to MEA as an alkalizer for Level 3 oxidation dye products, important among these is alkalizer concentration. To determine its effect, we prepared formulations without dyes at several molarities of alkalizing agent (0.27 M, 0.54 M, and 0.82 M on-tress concentra- tions, after mixing with H2O2 developer). For each level, batches were prepared using equimolar amounts of NH3 or MEA (unbuffered), and treatments were done on light brown hair. Protonic equilibria were not considered at this point because they are rapid and we are investigating extent of damage rather than rate of damage, and in the chassis we used, the ambient pH values of the equimolar solutions of MEA and ammonia with H2O2 are close (ca. ±0.1 units) at each alkalizer concentration. We used fi ve bleaching cycles to simulate approximately 6 months of product usage, and we combined this with 36 shampoo/conditioner cycles between each bleaching to mimic the grooming routine between coloring processes. Cysteic acid levels were measured after each bleach cycle (before washing) and after 36 shampoo/conditioner treatments. Table II shows that although the values are close within the given sets, there is a trend of increase in cysteic acid content that is dependent on alkalizer concentration and the number Figure 1. SEM photomicrographs obtained on a Hitachi S-3000N SEM with Oxford detector after the fi fth bleaching cycle of light brown hair treated with formulations containing 0.27 M ammonia (A) and MEA (B) for 30 min at 30°C. Table II Cysteic Acid Content of Light Brown Hair [Determined by Fourier Transform Infrared (FTIR) Spectroscopy] for Increasing Alkalizer Concentrations and Repetitive Lightening Cycles for Monoethanolamine (MEA) and Ammonia Formulations After 1–5 Bleach Treatments with 18 Shampoo/Conditioner Treatments (as Described Earlier) Between Each Cycle Alkalizer Alkalizer (M) Cysteic Acid–1 Cysteic Acid–2 Cysteic Acid–3 Cysteic Acid–4 Cysteic Acid–5 NH4OH 0.27 47 ± 3 57 ± 4 68 ± 3 78 ± 5 79 ± 4 MEA 0.27 45 ± 6 61 ± 6 73 ± 5 83 ± 5 88 ± 4 NH4OH 0.54 45 ± 6 64 ± 2 85 ± 2 90 ± 5 92 ± 3 MEA 0.54 52 ± 7 68 ± 5 86 ± 5 93 ± 6 99 ± 5 NH4OH 0.82 52 ± 6 75 ± 7 83 ± 6 96 ± 5 104 ± 7 MEA 0.82 55 ± 6 73 ± 4 88 ± 3 101 ± 4 107 ± 3
Purchased for the exclusive use of nofirst nolast (unknown)
From: SCC Media Library & Resource Center (library.scconline.org)