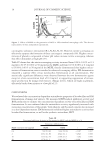
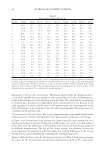
JOURNAL OF COSMETIC SCIENCE 6 mean ± S.D. The Student t-tests were carried out to test the difference in means with the signifi cance level of p 0.05 using SPSS 20.0 (IBM SPSS Statistics for Windows, Version 20.0, Armonk, NY). RESULTS AND DISCUSSION POLYPHENOL AND FLAVONOID CONTENTS Polyphenols affect the skin in a variety of ways and neutralize harmful oxidative species, thus acting as strong antioxidants (22). Polyphenols do not stimulate th e skin but suppress melanin production and, therefore, whiten the skin. This cosmetic effect may be due to a relationship between the amount of polyphenol used and the whitening effect (23). As outlined in Table I, the polyphenol content increased as the MLFE concentration in- creased from 7.43 ± 0.09 mg/g at 2 mg/ml to 30.58 mg/g ± 0.05 at 50 mg/ml. In the MEFE, the polyphenol content increased from 8.51 ± 0.05 mg/g at 2 mg/ml to 35.21 ± 0.04 mg/g at 50 mg/ml. The statistically signifi cant increases in polyphenol contents were detected for the MEFE in comparison to the MLFE for all concentration levels ex- cept at 10 mg/ml. However, a dose-dependent increase in polyphenol content was ob- served in both the MLFE and the MEFE. Fermentation-dependent fl avonoid contents are outlined in Table II. The fl avonoid con- tent in the MLFE increased from 1.35 ± 0.07 mg/g at 0.4 mg/ml to 8.89 ± 0.01 mg/g at 10 mg/ml. In addition, the fl avonoid content in the MEFE increased from 1.91 ± 0.02 mg/g at 0.4 mg/ml to 9.80 ± 0.05 mg/g at 10 mg/ml. These results confi rm that the fl avonoid content increased with increasing the MLFE and MEFE concentrations. The MEFE again yielded statistically higher concentration of fl avonoid at all concentra- tion levels except at 50 mg/ml where the MLFE yielded a higher fl avonoid content than the MEFE. These results are consistent with the previous study (24). In our study, we estimated that the change in intensity of mango leaf fermentation concentration infl uenced the fl avonoid con- tent, thus confi rming the antioxidative property of the mango leaf fermentation extracts (25). DPPH RADICAL SCAVENGING ACTIVITY DPPH radical scavenging activity allows the measurement of antioxidant activity based on EDA. Free radicals within the body react with proteins and other substances to Table I Polyphenols in the MLFE and the MEFE (n = 3) MLFE concentration (mg/ml) Polyphenol concentration (mg/g) t p-Value MLFE MEFE 0.4 3.38 ± 0.05 5.84 ± 0.02 −78.642 0.000 2 7.43 ± 0.09 8.51 ± 0.05 −18.262 0.000 10 22.52 ± 0.07 17.91 ± 0.06 86.552 0.000 50 30.58 ± 0.05 35.21 ± 0.04 −127.735 0.000

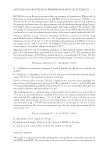
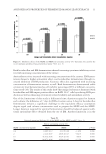
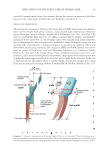
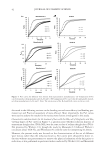
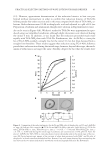
ANTIOXIDANT PROPERTIES OF FERMENTED MANGO LEAF EXTRACTS 7 accelerate aging, prompting researchers to explore natural substances that could neutral- ize free radicals (26). The antioxidative effects of variou s concentrations of the MLFE and the MEFE were evaluated by estimating the level of DPPH radical scavenging activity, as manifested in its EDA percentage. Figure 1 illustrates the increase in DPPH radical scavenging activity as EDA percentage increase from 33% at 2 mg/ml to 69% at 50 mg/ml for the MLFE and from 61% at 2 mg/ml to 72% at 50 mg/ml for the MEFE, thus demonstrat- ing that EM fermentation is more effective than lactobacillus fermentation at lower concentration levels but equivalent at higher levels (i.e., 50 mg/ml). The MLFE dem- onstrated signifi cantly higher antioxidative properties compared to the synthetic anti- oxidant, BHT, at all concentrations except for10 mg/ml (EDA 45%). Compared to BHT, the MEFE showed statistically higher EDA level for all levels of mango leaf fer- mentation extract concentrations. The exact mechanism of antioxidant action by the mango leaf extract is unknown, although previous reports have suggested that the material itself could promote cell proliferation or impart a protective effect from exter- nal stimulants (27–29). Table II Flavonoids in the MLFE and the MEFE (n = 3) MLFE concentration (mg/ml) Flavonoid concentration (mg/g) t p-Value MLFE MEFE 0.4 1.35±0.07 1.91 ± 0.02 −13.382 0.000 2 3.62 ± 0.02 5.84 ± 0.01 −171.00 0.000 10 8.89 ± 0.01 9.80 ± 0.05 −31.691 0.000 50 20.91 ± 0.04 16.74 ± 0.03 144.72 0.000 Figure 1. DPPH radical scavenging ability measured using percentage of EDA of the MLFE and the MEFE at different concentration levels (n = 3, mean ± S.D.).The synthetic antioxidant, B HT was used as control. P-values of t-tests comparing mean BHT and MLFE or MEFE are noted above.
Purchased for the exclusive use of nofirst nolast (unknown)
From: SCC Media Library & Resource Center (library.scconline.org)