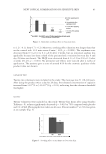
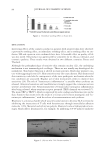
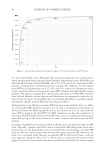
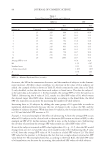
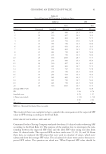
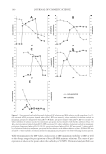
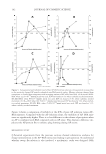
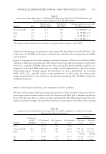
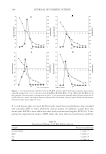
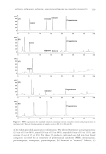
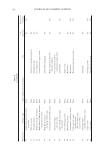
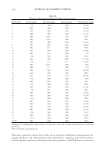
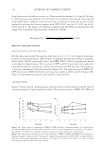
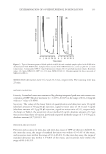
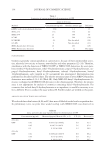
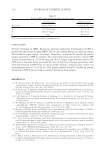
JOURNAL OF COSMETIC SCIENCE 100 Figure 1. Zeta potential and turbidity trend of selected AP solutions and BSA solution in pH range from 3 to 12, (A) activated ACH: precipitate formed when pH 5 IEP was around 9, where turbidity of solution reached its maximum precipitate disappeared when pH 9. (B) ZAG: precipitate formed when pH 5 IEP was around 9.5, where turbidity of solution reached its maximum precipitate did not dissolve with further addition of base. (C) Al13-mer: precipitate formed when pH 6 IEP was around 10, where turbidity of solution reached its maximum precipitate disappeared when pH 10. (D) ZG precipitate formed when pH 4 IEP was around 7, where turbid- ity of solution reached its maximum precipitate did not dissolve with further addition of base. (E) BSA: IEP was around 4.7, where turbidity of solution reached its maximum no precipitate was observed during titration process. Table II summarizes the IEP values, molar ratios at IEP, maximum turbidity at IEP, as well as the dosage ranges for precipitation of four AP–BSA mixture solutions. The onset of pre- cipitation is taken as the point where the turbidity is 50 NTU. Elemental analysis (EA) was

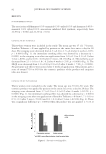
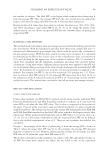
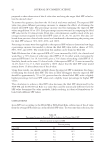
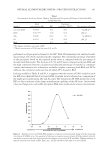
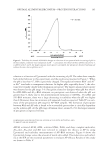
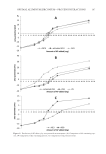
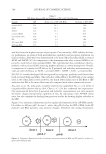
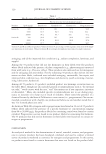
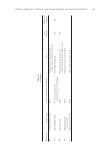
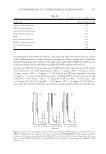
OPTIMAL ALUMINUM/ZIRCONIUM—PROTEIN INTERACTIONS 101 performed on all precipitates formed at the IEP. Table III summarizes the analyzed results of percentage of C, H, N, and metal in the complexes. The calculated percentage of metal(s) in the precipitate based on the reported molar ratios is compared with the percentage of metal(s) from EA results. The decrease of C, H, and N ratios compared with pure BSA and the high correlation between calculated and obtained percentage of metal(s) in complexes confi rm the formation of a substantive insoluble complex containing both BSA and AP. In addition, the correlation indicates that all added AP is bound to BSA. Looking carefully at Tables II and III, it is apparent that the amount of ZAG needed to reach the IEP is less than half that of activated ACH. A similar trend is observed in a comparison of the single species polycations, ZG and Al13-mer. The variation in AP–BSA molar ratio at the IEP is a direct indicator of the charge-neutralization capability of the AP active. Actives with a low size/charge ratio, such as ZG, precipitate BSA more readily and at a lower concentration. Table I Concentration, Isoelectric Points, Highest Turbidity and Precipitate pH Range of Individual BSA and AP Solutions Samples Metal concentration (M) IEP Optimum turbidity* (NTU) Precipitation pH range activated ACH 0.0094 9.21 89.5 b b 5 pH 9 ZAG 0.0071** 9.48 62.5 p pH 7 Al13 0.0090 10.02 71.7 b b10 7 pH ZG 0.0032 7.01 89.6 p pH 6 BSA - 4.72 21.9 - *The highest turbidity was found at IEP. **Metal concentration of ZAG was the sum of Al and Zr. Figure 2. Turbidity of activated ACH–BSA changes as a function of zeta potential change with the increasing of activated ACH/BSA ratio. Zeta potential of solutions increased as more activated ACH was added turbidity was fi rstly increased, and then decreased with the addition of activated ACH into BSA. Highest turbidity of mixture solutions were found at IEPs. ZAG, Al13, and ZG all behaved the same as activated ACH.
Purchased for the exclusive use of nofirst nolast (unknown)
From: SCC Media Library & Resource Center (library.scconline.org)