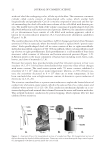
JOURNAL OF COSMETIC SCIENCE 14 fusion with a lysosome leading to the formation of an autolysosome, which then degrades and recycles cellular components. Autophagy can be considered to be a very effi cient quality control mechanism that maintains cell effi ciency and health (2). Decreases in autophagic activity have recently been associated with age. For example, hepatocytes were found to accumulate intracellular damage over time (3) and the loss of activity as described by Cuervo (4) has now been recognized as a major aging pathway. Furthermore, the link between impaired autophagy and age-associated illness has now been established for cancer, diabetes, and Alzheimer’s and Parkinson’s diseases and is cur- rently an active area of investigation. Aging tissues show an expansion of lysosomal com- partments, accumulation of autophagic vacuoles, and deposition of undigested materials inside the cells. These changes result in a decrease of energy supply and an increase in intracellular damages and oxidative stress, all of which have been shown to accelerate aging. Since metabolic intermediates are generated as a consequence of autophagy, caloric restric- tion has been shown to play a role in the life span extension associated with autophagy and this has been genetically confi rmed in Caenorhabditis elegans (5). In addition, circadian rhythms, which also coordinate metabolic activity, have been observed in yeast to temporally affect autophagy (6). To understand how these processes may infl uence cutaneous health and aging, we compared autophagy levels by measuring LC3B, a microtubule-associated protein correlated to late stage autophagosome formation (7) between young and aged skin fi broblasts, and then also analyzed these levels as a function of time. Furthermore, since human skin is constantly exposed to sunlight, we determined their response to environmental stress induced by ultraviolet A (UVA 320–400 nm). MATERIALS AND METHODS TISSUE CULTURE Normal human dermal skin fi broblasts from 2 day and 67-year-old donors were obtained from The Coriell Institute (Camden, NJ) and grown on 4-well chamber slides (2 × 10⁴ cells/well) for immunocytofl uorescence or on 60-mm dishes for RNA extraction (5 × 10⁴ cells/dish). They were cultured in Dulbecco’s Modifi ed Eagle’s Media (DMEM) media with 5% bo- vine calf serum and 1% penicillin/streptomycin at 37°C in a 5% CO2 humidifi ed incuba- tor. Cells were cultured for 72 h before the start of the experiment. CELL SYNCHRONIZATION Cells were synchronized via serum starvation. Cells to be synchronized were washed once with Dulbecco’s Phosphate Buffered Saline (D-PBS) and then treated with medium without serum. Medium with serum was placed on cells that were not synchronized. Cells were incubated for 24 h. After synchronization, the media were removed and medium with serum was added to both unsynchronized and synchronized cells. RNA was extracted at 0, 1, 2, 4, and 8 h after release from starvation. In a second experiment, synchronized cells were irradiated just before release from starvation and RNA extracted at the same time intervals as before. IMMUNOCYTOFLUORESCENCE Cells were fi xed with 4% paraformaldehyde and then permeabilized with methanol. Cells were blocked with 5% goat serum and 0.3% Triton X-100 (Sigma-Aldrich, St. Louis,

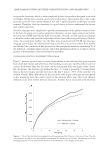
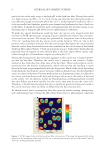
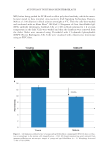
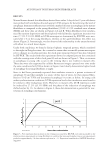
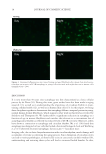
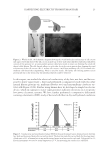
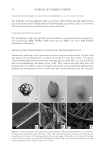
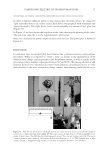
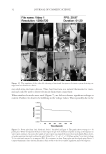
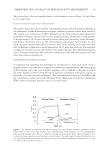
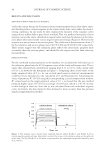
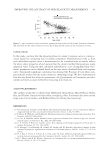
AUTOPHAGY IN HUMAN SKIN FIBROBLASTS 15 MO) before being probed for LC3B with a rabbit polyclonal antibody, which the manu- facturer stated to have minimal cross-reactivity (Cell Signaling Technology, Danvers, MA) at a 1:100 dilution in block solution overnight at 4°C. Then the cells were washed and incubated with an Alexa Fluor® 488 F(ab’) 2 Fragment of Goat Anti-Rabbit IgG (H+L) antibody (Invitrogen, Carlsbad, CA) at 1:400 in block solution for 1 h at room temperature in the dark. Cells were washed and then the chambers were removed from the slides. Slides were mounted using Vectashield with 4’,6-diamido-2-phenylindole (DAPI) (Vector, Burlingame, CA). Cells were visualized with a fl uorescence microscope using an FITC fi lter. Figure 1. (A) Immunocytofl uorescence of young and aged fi broblasts comparing LC3B levels show a reduc- tion in autophagy in the mature cells (magnifi cation = 20×). (B) Graph summarizing pixel intensity from immunocytofl uorescent microscopic images of young and aged fi broblasts (n = 4). Autophagy decreased 23.8% (±1.9% SEM).
Purchased for the exclusive use of nofirst nolast (unknown)
From: SCC Media Library & Resource Center (library.scconline.org)