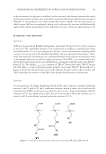
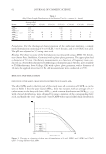
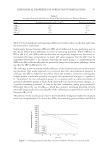
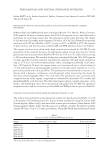
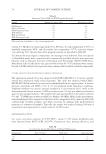
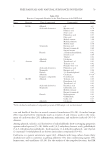
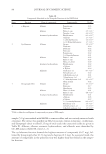
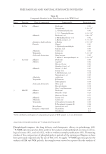
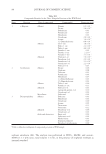
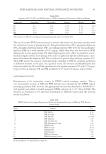
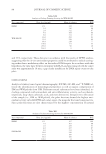
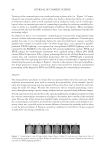
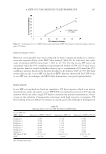
JOURNAL OF COSMETIC SCIENCE 76 Italy) and sandwiched between a lower layer of 1% (w/v) normal melting agarose (Bio- Rad Laboratories, Milan, Italy). For each compound, two sets of three slides each were prepared. An aliquot of 50 μl of H2O2 (0.25 μM) was added to one set, while PBS was added to the parallel set. The slides were kept at 4°C for 5 min and then immersed in lysing solution (2.5 M NaCl, 100 mM Na2EDTA, 10 mM Tris, pH 10) containing 10% DMSO and 1% Triton X-100 (ICN Biomedicals Inc., Irvine, CA) at 4°C overnight. Slides were then randomly placed in a horizontal gel electrophoresis apparatus with fresh alkaline electrophoresis buffer (300 mM NaOH, 1 mM Na2EDTA, pH 13) and incu- bated for 25 min at 4°C to allow for DNA unwinding and expression of alkali-labile sites. Electrophoresis was performed at 4°C for 15 min at 30 V (1 V/cm) and 300 mA. After electrophoresis, slides were immersed in 0.3-M sodium acetate in ethanol for 30 min. Slides were then dehydrated in an alcohol series (2 min at 70%, 85%, and 100%) and air-dried. Slides stained with 20 μg/ml ethidium bromide in the presence of antifade re- agent immediately before analysis were examined at 40× magnifi cation using an auto- mated image analysis system (Comet Assay III Perceptive Instruments, Suffolk, UK) connected to a fl uorescence microscope (Zeiss Axioskop 2, Milan, Italy). DNA damage was quantifi ed from the tail moment (TM) values. A number of 50 cells from each slide (150 cells in total) were analyzed per experimental point. RESULTS MINERALOGICAL COMPOSITION Four samples of DM and three samples of WM (namely, FS I–IV and FC II–IV, respec- tively) were collected from the fl oor of the pool Bagnaccio during four representative periods of the year: winter (sample I), spring (sample II), summer (sample III), and au- tumn (sample IV). The particle size was determined by wet sieving and sedimentation methods (21), while the triangle of Shepard was used for the particle size classifi cation (22). The inorganic constituents were identifi ed by liquid ion chromatography, and mi- nor and trace elements were detected by quadrupole ICP-MS. The mineralogical compo- sition was defi ned by both diffraction analysis (Goniometer Seifert MZIV q/2q) and chemical analysis (ICP-MS). Results for DM and WM peloids are given in Tables V and VI, respectively. Samples FS II and FS IV were silty sands, while FS I and FS III were silt and sand, respectively (Table V). The percentage of clay was quite homogeneous with a standard deviation lower than that calculated for the surroundings sand and silt. The grain size composition of WM was rather heterogeneous (Table VI), with a slight predominance of sand and silt fractions (sandy silt, silty sand, sandy silt clay). The diagram of Shepard, percentages of sand, silt, and clay, respectively, are given in Supplemental #2 (Supplemental Figures 9–12). The cumulative curves (Supplemental #2, Supplemental Figure 13) of WM and DM were well sorted, in agreement with values lower than 100 of the uniformity coeffi cient U, given by the ratio between the particle diameter at 60% and the diameter at 10% (Table VII). The DM peloid consists of alumina silicates of kaolinite and montmorillonite type, while WM peloid of microcrystalline calcium sulfate. Among minor elements, relatively high

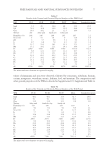
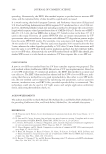
FREE RADICALS AND NATURAL SUBSTANCES IN PELOIDS 77 Table VI Results of the Textural and Chemical–Physical Analyses of the WM Peloid WM FC II FC III FC IV Mean Standard deviation Sand 49.1 49.1 15.5 41.7 24.6 Silt 39 39 72.4 48.6 22.9 Clay 11.9 11.9 12.1 9.8 2.8 Texture Silty sand Sand silt clay Sandy silt Humidity (%) 145 150 155 150 5 pH 4.2 6.2 4.1 4.6 1.1 N tot (%) 8 11 18 12.3 5.1 Li 7.7 7.9 6.5 7.4 0.8 V 12.4 11.4 12.9 12.2 0.8 Mn 14.4 13.3 11.1 12.0 1.7 Fe 2865 2975 3100 2980 117.6 As 8.6 10.6 12.1 10.4 1.8 Rb 29.9 28.2 28.6 28.9 0.9 Sr 56.8 55.9 70.9 61.2 8.4 Cs 16.3 18.5 14.1 16.3 2.2 Ba 19.3 22.4 21.5 21.1 1.6 Pb 6.3 8.5 5.7 6.8 1.5 U 1.5 2.5 1.8 1.9 0.5 Al 6870 7150 7320 7113.3 227.2 The minor and trace elements are reported in mg/kg. Table V Results of the Textural and Chemical-Physical Analyses of the DM Peloid DM FS I FS II FS III FS IV Mean Standard deviation Sand 3.3 45 36.4 48 33.2 20.5 Silt 78.4 36.8 40.6 39.5 48.8 19.8 Clay 18.3 18.2 23 12.5 18.0 4.3 Texture Silt Silty sand Sandy silt Silty sand Humidity (%) 144 146 148 143 145 2.2 N tot (%) 5 15 18 9 11.8 5.9 pH 4 5.7 6.6 5.1 5.4 1.1 Li 8.7 6.8 7.9 9.1 8.1 1.0 V 13.7 15.2 18.1 22.1 17.3 3.7 Mn 15.2 18.2 22.1 18.1 18.4 2.8 Fe 2969 3550 3489 3780 3447.0 342.4 As 6.6 12.1 11.9 12.2 10.7 2.7 Rb 27.7 32.3 35.1 40.1 33.8 5.2 Sr 54.5 60.1 65.2 70.2 62.5 6.7 Cs 17.3 18.2 19.5 21.5 19.1 1.8 Ba 21.2 21.2 20.1 18.9 20.4 1.1 Pb 7.1 8.2 9.2 11.2 8.9 1.7 U 1.2 2.1 3.1 2.8 2.3 0.8 Al 6700 8960 9250 8970 8470.0 1187.6 The minor and trace elements are reported in mg/kg. values of aluminum and iron were observed, followed by strontium, rubidium, barium, cesium, manganese, vanadium, arsenic, lithium, lead, and uranium. The composition and other general properties of the TSB are detailed in Supplemental #3, Supplemental Table A.
Purchased for the exclusive use of nofirst nolast (unknown)
From: SCC Media Library & Resource Center (library.scconline.org)