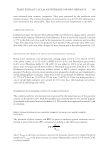
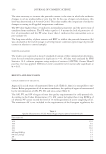
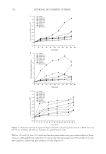
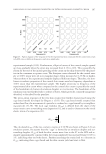
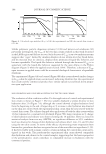
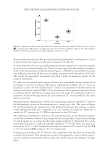
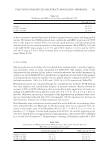
THE TORSIONAL LOSS MODULUS IN HUMAN HAIR 177 observed with the values for hair given by Persaud and Kamath (4) and Harper et al. (11) as well as from other sources on the basis of equation (5) (18–20). Λ values drop after the waving and bleaching treatment compared to virgin hair, signify- ing a decrease of internal energy loss. Values increase again after the shampoo treatment. In line with the qualitative impression from Figure 1, ANOVA as well as LSD tests show that differences between all data sets are highly signifi cant well beyond the 95% level. The results for logarithmic decrement thus show a high discriminative power for the cosmetic treatments. G″ values are determined with equation (8) from the individually obtained values for Λ (see Figure 1) and G′ (see Figure 2B) and are summarized in Figure 2A. G″ values are roughly by a factor 50–100 smaller than G′, which is in agreement with observations by dynamic mechanical analysis (DMA) (19) and attributed to the general properties of hair as a glassy polymer well below its glass transition (16) under the conditions of the mea- surements. In line with expectations for such a material, G″ increases when G′ decreases and vice versa (21). Moving from the experimental variable Λ to the primary, physical variable G″, much of the discriminative power of the measurement of energy loss is lost. The insets in Figure 2A and B summarize the signifi cance of the differences between the samples, as deter- mined through the LSD test. Compared to G′, the number of signifi cant differences is smaller for G″, leaving only V WB as signifi cant on the 95% level. This difference of performance and loss of discriminative power are attributed to compen- sation effects between values for the storage and the loss modulus, respectively. Plotting G″ and Λ against G′, as is done for the virgin sample in Figure 3, shows that the correla- tion between Λ and G′ is only faint though signifi cant (r2 = 0.08), while it is quite pro- nounced for G″ (r2 = 0.69). Similar observations were made for G″ versus G′ for the WB (r2 = 0.74) and the WBS sample (r2 = 0.77), respectively. Underlying the analysis for G″ above is the assumption that the data are essentially normally distributed. This assumption seems to be apparently correct, when inspect- ing the cumulative probability plots of the data, which all provide adequate straight lines. Figure 1. Summary of data for the logarithmic decrement Λ for the three samples. Data are given as means ( ), standard errors (SE) (boxes), and limiting values for the 95% confi dence range (1.96 × SE: whisker). Differences between all data sets are highly signifi cant on the 95% level.

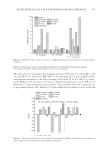
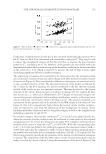
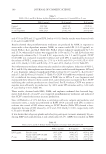
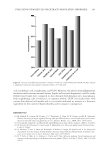
JOURNAL OF COSMETIC SCIENCE 178 APPLICATION OF THE CORE/SHELL MODEL When plotting G″ against the moment of inertia for all samples, systematic decreases are observed (see Figure 4), similar as for G′ (3,4). These observations are generally in line with data by Leray and Winsey (22) from torsional stress relaxation for both modulus and relaxation gradient. As for G′, this highlights that G″ for hair is not a material constant. The decrease as such is in line with the core/shell model [equation (9)] and implies that the cuticle has a higher G″ value than the cortex, as related to the limiting values for G″ at low and high values of I, respectively. The observation that G′ and G″ values both decrease with increasing moment of inertia (3) implies that both storage and loss modulus are higher for the cuticle than for the cor- tex. For the current cases, the correlated changes of G″ and G′, as shown in Figure 3, lead to the compensation effects for Λ, as mentioned earlier. Equation (9) was fi tted to the data applying nonlinear regression. The free optimization showed that the estimate for G″co gave slightly negative values in all cases (G″co ≥ -0.005 GPa), which is physically not reasonable. For this reason, G ≥ 0 was introduced as a boundary condi- tion for the fi t. Table I summarizes the results of the fi ts for G″co and G″cu together with the associated 95% confi dence ranges and the coeffi cients of determination r2. The solid lines through the data in Figure 4 are based on equation (9) and the parameter values in Table I. Figure 2. Summary of (A) G″ data and (B) G′ data for all samples. Data are given as means ( ), standard errors (SE) (boxes), and limiting values for the 95% confi dence range (1.96 × SE: whisker). Insets give the results of least signifi cant difference (LSD) multiple comparison of means tests with their levels of signifi cance ( p values). If p 0.05, effects are signifi cant on the 95% level.
Purchased for the exclusive use of nofirst nolast (unknown)
From: SCC Media Library & Resource Center (library.scconline.org)