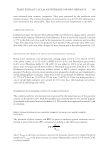
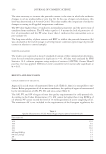
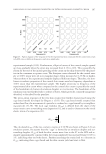
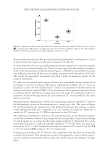
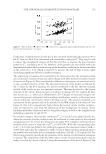
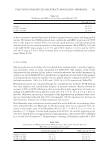
EVALUATION OF MOLECULES OR EXTRACTS MODULATING SEBORRHEA 187 dated August 9, 2004, concerning public health. Moreover, our studies follow the spirit of good clinical practices (ICH E6 GCP, 1996). As a noninterventional study, neither advice of an ethic committee nor submission to competent authorities are required. How- ever, an internal ethic committee was asked to allow these studies. For sebum production study, 23 volunteers (women, [19–32 years] mean: 24.5 years) were recruited, with oily skin and acne prone skin, some regularly had acne-type blem- ishes on the face. Cream containing 0.8 mM CCSV was applied daily onto hemiface, whereas the other hemiface received the corresponding placebo cream. Modulation of sebum production and number of active glands were evaluated using Sebufi x® (Courage & Khazaka®) and image analysis through Mountains Map® software (Digital Surf®). Mea- surements were done one night after the last application. Skin blemishes were evaluated on several panels (Sederma®, Cosmetest®) due to the dif- fi culty in recruiting volunteers with blemishes in a suffi cient number and intensity. Cream applications were the same as the precedent test. Blemishes were evaluated on standardized pictures made under cross polarized lighting with a photographic bench (Orion Concept®). The skin specifi c software Framescan® (Orion Concept®) was used to quantify blemishes based on redness threshold. Hyperkeratosis was performed at BioEC® using cyanoacrylate biopsies on volunteers with oily skin and comedones on face (women and men, [18–45 years] mean: 32 years) after a daily application of a cream containing CCSV. Assessment was achieved after Figure 3. NHS in NHS-7 culture medium + linoleic acid 10-4 M at passage 8 (left picture) and 20 (right picture). Lipids are labeled using Red Oil ×250. Figure 4. NHS in NHS-7 culture medium at passage 9 without (left) or with (middle) linoleic acid 10-4 M. Lipids are labeled using red oil ×250. Right picture: human adipocytes.

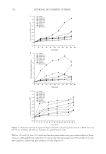
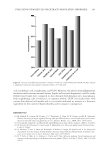
JOURNAL OF COSMETIC SCIENCE 188 Hemalun/Congo red staining and observations with microscope of orange masses at the pore opening. Perceived effect study was done on 100 volunteers (women and men, [18–30 years] mean: 24 years) with oily skin and acne-prone skin and regularly occur- ring pimples. Self-evaluations were performed by volunteers on cosmetic qualities and activities of the CCSV cream after 1 month of daily application on face. Statistical studies were performed using the Student’s t test or if necessary, a Wilcoxon nonparametric test. In both case, bilateral tests were performed on paired series. χ2 test was used for self-evaluations. RESULTS CELL CULTURE AND SKIN EXPLANTS NHSs have various features and size in culture. They present mainly an epithelial mor- phology, but have a specifi c polygonal shape while some cells are rounded once anchored, they grow as islets, spread on plastic within few days and increase their lipid storage (Figure 1). Cells did not grow without FCS, 5% FCS being the lowest concentration for NHS growth whatever the medium used. Cells grew and stored lipids in DMEM-F12 and KSFM + BPE, both completed with 25–50 μg/ml EGF, whereas proliferation was weaker than latter with DMEM or M154 (±EGF). DMEMc with dexamethasone, insulin, indomethacin, and IBMX (DMEMcDI3), used for pre-adipocyte differentiation studies, was toxic for NHS (Figure 2). A specifi c blend of medium and supplements, referred as NHS-7 medium, led to a maximum population doubling time and preserved lipid stor- age capacities up to 20 passages (Figure 3). Moreover, NHS multiplied less in KSFM + BPE media containing high calcium content (0.8–1.8 mM) than in same media with low calcium concentration high calcium concen- trations triggered in NHS very low differentiation features as obtained with NHK. Weak involucrin and fi laggrin labelling were observed, in agreement with Lee et al. (12). Table I Lipid Modulation in NHS Under Various Concentrations of CCSV. Lipids are Labeled Using Red Nile AFUa—Red Nile/106 cell Variation (%) Control solvent (mM) 49 727 ± 8202 Reference CCSV 0.16 46 945 ± 2389 -5.6 nsd CCSV 0.48 31 551 ± 1038 -36.6 p 0.05 CCSV 0.8 20 936 ± 2213 -57.9 p 0.01 aAFU: arbitrary fl uorescent units no cell toxicity was observed as compared to control. Table II PGE-2 Release by NHS in Contact with LPS and Under Treatment with CCSV. No Cell Toxicity was Observed as Compared to Control PGE-2 (pg/106 cell) Control (solvent) CCSV 0.48 mM No LPS 75.5 ± 6.1 38.6 ± 6.4 LPS 1.2 μg/ml 124.0 ± 6.3 88.5 ± 9.2 LPS 2. 5 μg/ml 156.2 ± 14.4 82.4 ± 11.4
Purchased for the exclusive use of nofirst nolast (unknown)
From: SCC Media Library & Resource Center (library.scconline.org)