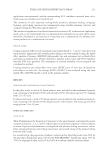
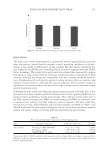
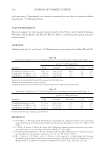
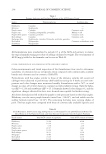
EVALUATE SKIN DISINFECTANT SPRAY 211 application were presented, and the corresponding 95% confi dence intervals were calcu- lated using one-sample exact binomial test. The intensity of each reported cooling/fresh sensation, pleasant feeling, stinging/ burning, and itching sensation was summarized using suitable summary statistics and compared using the Wilcoxon signed-rank test. The statistical signifi cance level for all statistical tests was 0.05 as this was an exploratory study with a very small sample size no adjustment for multiplicity was used. All p-values should be considered as an indicator of a trend but not a confi rmation of a difference be- tween products or a confi rmation of a trend. PIVOTAL STUDY Cooling sensation VAS at each assessment time (immediately 3, 5, and 15 min after each study product application) and overall product liking score were analyzed using the mixed effect analysis of variance (ANOVA) with product use and assessment site as fi xed effects and subject as random effect. Product differences together with p-values and 95% Confi dence Intervals (CIs) were provided. The assumption of residual normality was investigated and considered as satisfi ed. Cooling sensation area under effect-time curve (AUEC) over 15 min was calculated for each subject on each test. An average AUEC (AUEC/15) was analyzed using the same mixed effect ANOVA model as used in the primary analysis. RESULTS DEMOGRAPHICS AND BASELINE CHARACTERISTICS In the pilot study, a total of 12 Asian subjects were included in the randomized popula- tion consisting of six females (50%) and six males (50%). The mean age was 39.3 ranging from 21 to 53 year. In the pivotal study, a total of 50 Asian subjects were included in the randomized popula- tion consisting of 25 females (50%) females and 25 (50%) males. The mean age was 40.0 ranging from 21 to 59 year. EFFICACY RESULTS PILOT STUDY Table II summarizes the frequency of responses to the questionnaire containing fi ve-point categorical scales (1, 2, 3, 4, and 5), where subjects rated their responses to the treatments in terms of perceived performance (cooling/fresh and pleasant feeling intensities), tolera- bility (stinging/burning and itching intensities), and overall rating of the product liking from the pilot study. For overall rating, the proportion of subjects indicating they liked the product was 58% for the prototype disinfectant spray, 64% for the BACTROBAN® disinfectant spray, 33% for 70% v/v isopropyl alcohol, and 42% for 0.9% w/v sodium chloride solution (saline).

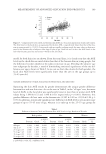
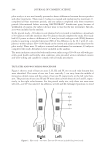
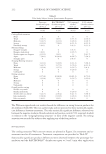
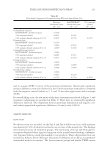
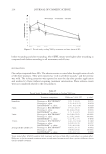
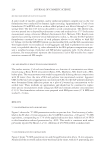
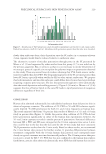
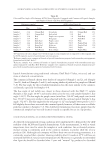
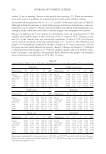
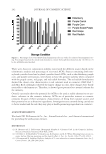
JOURNAL OF COSMETIC SCIENCE 212 The Wilcoxon signed-rank test results showed the difference in rating between products for all attributes (Table III). This was a pilot study and not powered to show statistically signifi - cant differences between treatments. The only statistically signifi cant difference observed was between the negative (sodium chloride solution) and positive control (70% isopropyl alcohol) in relation to the “stinging/burning sensation” in favor of the negative control. No itching sensation was recorded by subjects after applying any of the four products. PIVOTAL STUDY The cooling sensation VAS score raw means are plotted in Figure 2 by treatment and as- sessment time for all treatments. Treatment comparisons are provided in Table IV. Statistically signifi cant product differences were observed between the prototype for- mulation and the BACTROBAN® disinfectant spray at 3 and 5 min after application Table II Pilot Study Subject Sensory Questionnaire Responses Prototype disinfectant spray (N = 12) BACTROBAN® disinfectant spray (N = 11) 70% isopropyl alcohol (N = 12) 0.9% sodium chloride solution (N = 12) N (%) N (%) N (%) N (%) Cooling/Fresh sensation None 0 0 0 0 Weak 2 (16.7) 1 (8.3) 4 (33.3) 2 (16.7) Moderate 5 (41.7) 4 (33.3) 3 (25.0) 2 (16.7) Strong 4 (33.3) 7 (58.3) 4 (33.3) 4 (33.3) Extremely strong 1 (8.3) 0 1 (8.3) 4 (33.3) Pleasant feeling Disagree strongly 0 0 1 (8.3) 0 Disagree moderately 1 (8.3) 0 2 (16.7) 0 Neither agree nor disagree 4 (33.3) 1 (9.1) 0 5 (41.7) Agree 7 (58.3) 10 (90.9) 8 (66.7) 7 (58.3) Strongly agree 0 0 1 (8.3) 0 Stinging/Burning sensation None 4 (33.3) 5 (45.5) 4 (33.3) 7 (58.3) Weak 5 (41.7) 3 (27.3) 3 (25.0) 4 (33.3) Moderate 3 (25.0) 3 (27.3) 2 (16.7) 1 (8.3) Strong 0 0 3 (25.0) 0 Unbearable 0 0 0 0 Itching sensation None 9 (75.0) 10 (90.9) 10 (83.3) 9 (75.0) Weak 3 (25.0) 1 (9.1) 2 (16.7) 3 (25.0) Moderate 0 0 0 0 Strong 0 0 0 0 Unbearable 0 0 0 0 Overall product rating Dislike very much 0 0 0 0 Dislike moderately 0 0 3 (25.0) 0 Neither like nor dislike 5 (41.7) 4 (36.4) 5 (41.7) 7 (58.3) Like moderately 6 (50.0) 6 (54.5) 3 (25.0) 5 (41.7) Like very much 1 (8.3) 1 (9.1) 1 (8.3) 0
Purchased for the exclusive use of nofirst nolast (unknown)
From: SCC Media Library & Resource Center (library.scconline.org)