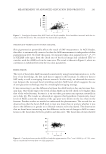
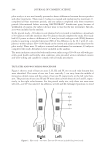
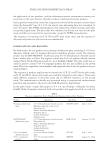
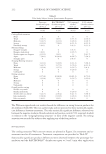
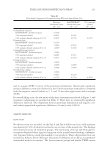
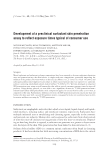
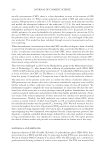
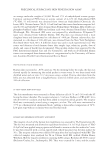
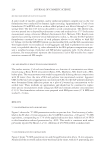
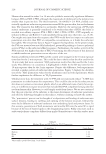
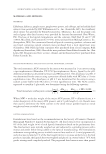
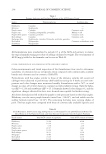
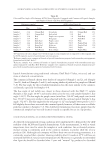
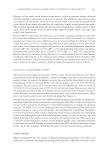
MEASUREMENT OF ADVANCED GLYCATION END-PRODUCTS 199 model for both skin sites are shown. From the trend lines, it is clearly seen that the AGE levels in the cheek skin are much lower than that of the forearm skin in young people, but the difference becomes smaller as the subjects increase in age. Dividing the subjects’ age into subgroups by decades, a trend of diminishing statistical signifi cance of the site dif- ference over age is shown in Table I. As we can see from the column for both genders, the facial skin AGE levels were signifi cantly lower than the arm in the age groups up to 35–45 year old. GENDER DIFFERENCE OF SKIN AGE LEVELS BETWEEN FACE AND ARM SITES Separating the skin AGE results by gender demonstrates the unique gender difference between face and arm skin sites. As can be seen in Table I, in the “all ages” row, the mean level of AGEs in the facial skin was signifi cantly lower in men than in women with AFR values being 1.648 ± 0.52 and 1.946 ± 0.59, respectively ( p 0.001). However, this gender difference did not exist at the forearm site (1.925 ± 0.40 vs. 2.034 ± 0.48, p 0.05). In addition, statistically signifi cant site difference of AGE level is seen in men’s age groups of up to 35–45 year of age, whereas it is only up to the 25–35 age group for Figur e 3. Comparison between cheek and forearm skin AGEs in a Caucasian population of men and women. The AGE level in the facial skin, as represented by the skin AFR, is signifi cantly lower than that of the fore- arm in young people ( p 0.001). It increased with age rapidly, reaching nearly the same values as that mea- sured in the forearm skin of subjects older than 60 year of age. Dark line and circles = the AGE levels in the left volar forearm gray line and crosses = AGEs in the left cheek. Table I D ifferences between Cheek and Forearm Skin AGE Levels in Age Brackets of Decades Both genders Men Women Forearm Cheek p @95% CL Forearm Cheek p @95% CL Forearm Cheek p @95% CL All ages 1.994 1.849 0.000 1.925 1.684 0.001 2.034 1.946 0.159 Age 25 1.546 1.187 0.002 1.525 1.134 0.012 1.559 1.219 0.020 25 age 35 1.688 1.455 0.000 1.668 1.274 0.000 1.700 1.560 0.036 35 age 45 2.001 1.815 0.014 1.954 1.742 0.028 2.050 1.891 0.272 45 age 55 2.113 2.092 0.707 2.045 1.894 0.206 2.151 2.200 0.586 55 age 65 2.474 2.344 0.163 2.484 2.374 0.600 2.471 2.336 0.402 p: probability value CL: confi dence level.

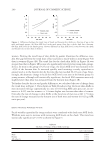
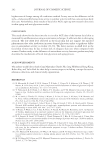
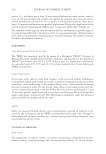
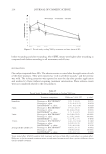
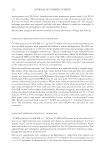
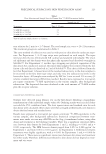
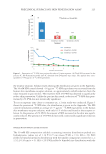
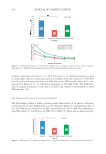
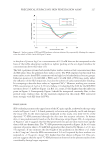
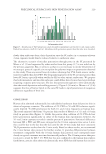
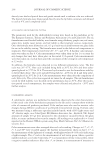
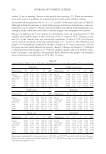
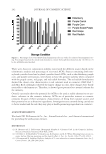
JOURNAL OF COSMETIC SCIENCE 200 women. Plotting the trend lines of skin AGEs by gender illustrates the difference visu- ally. The gap between the trend lines of face and arm is much wider in men (Figure 4A) than in women (Figure 4B). The trend line for the cheek skin AGEs in Figure 4A was steeper than that in Figure 4B because of a signifi cantly lower level in young male groups. In fact, for men in the group of 25 year of age, the facial AGE level was measured to be ~65% of the forearm skin. It increased quickly until attaining a nearly equivalent or greater level as in the forearm skin by the time the men reached 60–65 year of age. Inter- estingly, this dramatic change in facial skin AGE level is not seen in the female group. In young women, although still statistically signifi cant, the facial SAF measures were only slightly lower than what was measured from the forearm skin (Figure 4B). To further describe the site and gender differences, we calculated the rate of change from the trend lines in Figure 3. Data shown in Table II indicate that the facial skin AGEs in men increased with age exponentially in a rate of 0.021 (log AFR units per year), in con- trast to a 0.015 rate for women—a 1.4 times higher rate for men than that of women. Critically, the rate of change in skin AGEs at the facial site of men was a full 1.75 times the rate of change measured at the forearm site of both men and women (0.012 log AFR units per year). EFFECT OF FACIAL WRINKLES ON AGE Facial wrinkles quantifi ed by image analysis were correlated with cheek area AGE levels. Wrinkles were seen to increase with increasing AGE levels on the cheek. This trend was statistically signifi cant (p 0.05) as shown by Figure 5. Figure 4. Differences between the trend lines of cheek and forearm skin AGEs as a function of age in the male and female groups. (A) Skin AGE level in the male group. Gray line = cheek dark line = forearm. (B) Skin AGE level in the female group. Greater difference in skin AGE level is seen between the cheek and forearm sites in men than in women. Table II The Rate of Change of Skin AGEs with Age Left cheek Left volar forearm Male 0.021 0.012 Female 0.015 0.012 All subjects 0.017 0.012
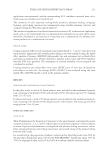
Purchased for the exclusive use of nofirst nolast (unknown)
From: SCC Media Library & Resource Center (library.scconline.org)