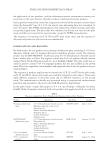
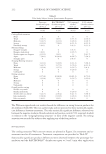
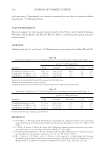
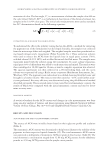
PRECLINICAL SURFACTANT SKIN PENETRATION ASSAY 223 tant solution for 2 min (n = 2–7/donor). The total sample size was n = 20–21/treatment. The treatment groups are summarized in Table I. The same method of collection was used as with porcine skin after the surfactant expo- sure. For Experiment 1, 4–10 tape strips were performed on each sample. The tapes were put directly into Ultima Gold XR cocktail and analyzed individually. The resid- ual epidermis and the dermis were also physically separated and dissolved overnight in Solvable™. For Experiment 2, neither tape stripping nor physical separation of the skin layers was conducted instead, the rinsed skin samples were removed from the dif- fusion cells and directly dissolved in 2 ml of Solvable™. This choice followed from the fact that Experiment 1 showed most of the residual radioactivity in the skin samples to be recovered in the fi rst three tape strips and only very low radioactivity levels in the lower skin layers. All samples were analyzed by LSC for 5 min or until 2% accuracy [2 relative standard deviations (SDs)] was reached. Results were expressed as microgram per square centimeter 14 C-SDS equivalents in the various samples, after background subtraction. The deposited dose was calculated as the total amount of 14 C-SDS in skin plus the receptor solution. HUMAN SKIN STATISTICAL ANALYSIS Outliers were detected using Dixon’s test on the full dataset following a logarithmic transformation of the individual sample values (8). Outlying results were rejected if they exceeded the 95% confi dence limit. The least squares mean and standard error for each skin donor were calculated these values were then averaged arithmetically over donors to obtain the fi nal mean and standard error. Results were expressed as microgram per square centimeter 14 C-SDS equivalents in the various samples, after background subtraction. Statistical comparisons between treat- ments were made via two-way ANOVA on the (log10)-transformed values, using skin donor and treatment as the blocking variables. There was a signifi cant statistical differ- ence between skin donors for both Experiments 1 and 2, yielding p 0.001 and p = 0.020, respectively. The SEM between donors ranged from 0.052 to 0.086 μg/cm2 for Experiment 1 and from 0.061 to 0.110 μg/cm2 for Experiment 2. Differences between treatments were highly signifi cant, with p 0.001 for Experiment 1 and p = 0.009 for Experiment 2. There were no signifi cant interactions between skin donor and treatment for either study. Therefore, differences attributed to skin donor did not depend on treat- ment and vice versa. Table I Do se Solutions and Sample Sizes for Human Skin 14 C-SDS Penetration Studies Treatments Sample size (n)a Expt. 1 10-min Expt. 2 2-min 50 mM SLS (control) 14 20 50 mM SLS + 2% PEO 15 21 50 mM SLS + 2% PVA 14 21 a Sum of replicate samples from 3 to 4 donors.

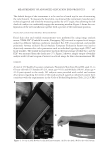
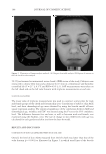
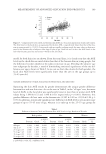
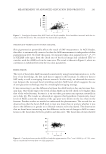
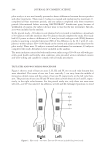
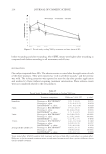
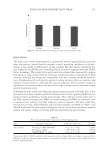
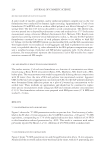
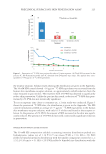
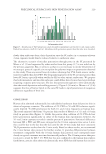
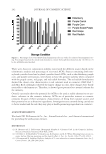
JOURNAL OF COSMETIC SCIENCE 224 MICELLE/MACROMOLECULE SIZE ANALYSIS A pilot study of micelle, polymer, and/or surfactant/polymer complex size in the test formulations was conducted by dynamic light scattering. Approximately 1.5 ml of test formulation (50 mM SLS with or without added polymer) was fi ltered through a 0.1-μm syringe fi lter. The fi rst 0.25 ml was discarded to avoid contamination. The fi ltered solu- tion was poured into a disposable polystyrene cuvette and analyzed via a 173°-backscatter measurement using a Zetasizer (Malvern Instruments Ltd., Malvern, UK). Results were reported as scattering intensity versus hydrodynamic radius, rh. Because the SLS–polymer formulations contained an excess of each polymer relative to its ability to bind SLS [cf. Cabane (11) for the SDS/PEO system see also Goddard (6)], and the SLS concentrations were high relative to its tendencies to self-aggregate and bind to polymers (see next sec- tion), it is probable that the rH values obtained for the SLS–polymer compositions repre- sent a weighted average of polymer and SLS/polymer aggregate radii. In the absence of polymers, the measurements represent the characteristic size of SLS micelles for a repre- sentative commercial SLS sample. CMC AND RELATED SURFACE TENSION MEASUREMENTS The surface tension, γ, of each test formulation as a function of concentration was deter- mined using a Krüss K100 tensiometer (Krüss USA, Matthews, NC) fi tted with a Wil- helmy plate. The measurements were made by sequentially diluting the test compositions with DI water thus, the ratio of SLS and polymer was maintained constant. Apparent CMC for SLS and critical aggregation concentration (CAC) for the SLS–polymer mixtures were determined from infl ection points on a plot of γ versus log concentration as de- scribed later. These methods are approximate and should not be construed to replace more precise measurements made using pure SDS and constant polymer concentrations (11,12). Test formulation solutions were prepared with Millipore water (17.8 M) and studied 1–3 times. RESULTS 14 C-SDS PENETRATION INTO PORCINE SKIN Figure 1 shows the 14 C-SDS penetration results on porcine skin. Total recovery of radio- label in the SC after a 10-min exposure to the 50 mM SLS control was ~100 μg/cm2 14 C-SDS equivalents, corresponding to 3.7% of the applied radioactive dose. Addition of 2% PEO to this formulation reduced penetration by ~80%. This result is consistent with values previously reported by Moore et al. (1). Addition of 2% PVA yielded a similar result. 14 C-SDS PENETRATION INTO HUMAN SKIN Figure 2 shows 14 C-SDS penetration into and through human skin after a 10-min exposure. Nearly all of the recovered radioactivity was found in the tissue, with 1% penetrating into
Purchased for the exclusive use of nofirst nolast (unknown)
From: SCC Media Library & Resource Center (library.scconline.org)