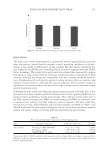
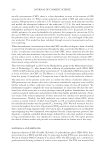
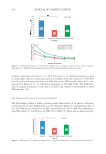
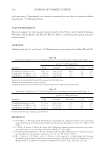
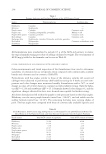
EVALUATE SKIN DISINFECTANT SPRAY 213 and in average AUEC in favor of the prototype formulation. Statistically signifi cant product differences were also observed in favor of the prototype formulation compared with the negative control (saline) at 3, 5, and 15 min after application and in average AUEC. For overall liking score, the raw means of the three treatments are plotted in Figure 3, and treatment comparisons are provided in Table V. There were no statistically signifi cant differences observed. The comparison between prototype formulation and negative con- trol (saline) approached signifi cance (difference 0.4 and p-value 0.0561). SAFETY RESULTS PILOT STUDY No adverse event was recorded. At the Day 4 and Day 8 follow-up visits, mild erythema was observed in 50% of subjects localized at one or more of the wound sites. The fi ndings were observed across all treatment groups. The examining clinician and Principal In- vestigator diagnosed these signs as being part of the normal wound healing, infl amma- tory response with no causal relationship to test products. These observations were not recorded as Adverse Event (AEs) per the protocol defi nition of an AE as an untoward/ unintended medical occurrence. The four treatment groups had similar TEWL means Table III Pilot Study Comparison of Treatments using Wilcoxon Signed-Rank Test Prototype disinfectant spray (N = 12) BACTROBAN® disinfectant spray (N = 11) 70% isopropyl alcohol (N = 12) Cooling/Fresh sensation BACTROBAN® disinfectant spray 0.7500 70% isopropyl alcohol 0.6875 0.5625 0.9% sodium chloride solution (N = 12) 0.1825 0.1758 0.4375 Pleasant feeling BACTROBAN® disinfectant spray 0.1250 70% isopropyl alcohol 1.0000 0.5625 0.9% sodium chloride solution (N = 12) 1.0000 0.2500 1.0000 Stinging/Burning sensation BACTROBAN® disinfectant spray 1.0000 70% isopropyl alcohol 0.4082 0.5313 0.9% sodium chloride solution (N = 12) 0.1875 0.3594 0.0313 Itching sensation BACTROBAN® disinfectant spray 1.0000 70% isopropyl alcohol 1.0000 1.0000 0.9% sodium chloride solution (N = 12) 1.0000 1.0000 1.0000 Overall product liking BACTROBAN® disinfectant spray 1.0000 70% isopropyl alcohol 0.0625 0.1250 0.9% sodium chloride solution (N = 12) 0.3750 0.3750 0.5625

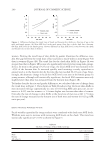
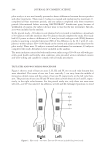
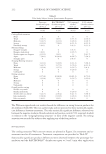
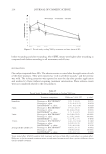
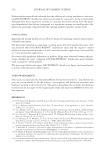
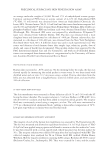
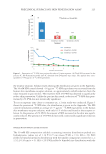
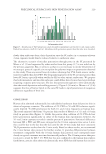
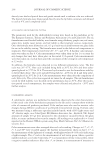
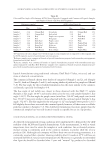
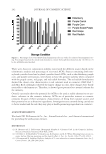
JOURNAL OF COSMETIC SCIENCE 214 before wounding and after wounding. The TEWL means were higher after wounding as compared with before wounding in all treatments and all sites. PIVOTAL STUDY One subject reported three AEs. The adverse events occurred after the application of each of the three products. They were reported as “itch in all three wounds,” and the severity was mild. The itching sensation was reported to start the day after product application and resolved 2 d later without requiring treatment intervention. These adverse events were not considered related to the test products. Figure 2. Pivotal study cooling VAS by treatment and time (mean ± SE). Table IV Pivotal Study Treatment Comparison on Cooling VAS Score Treatment comparison Differencea (95% CIa) p-valuea Immediate Prototype vs. BACTROBAN® 0.5 (-5.4, 6.3) 0.8711 Prototype vs. saline 5.5 (-0.4, 11.3) 0.0659 BACTROBAN® vs. saline 5.0 (-0.8, 10.8) 0.0928 3 min Prototype vs. BACTROBAN® 9.7 (2.7, 16.7) 0.0069 Prototype vs. saline 1s1.4 (4.4, 18.4) 0.0016 BACTROBAN® vs. saline 1.7 (-5.3, 8.7) 0.6323 5 min Prototype vs. BACTROBAN® 14.3 (8.4, 20.2) 0.0001 Prototype vs. saline 12.1 (6.2, 18.0) 0.0001 BACTROBAN® vs. saline -2.2 (-8.1, 3.7) 0.4645 15 min Prototype vs. BACTROBAN® 4.4 (-1.6, 10.4) 0.1482 Prototype vs. saline 6.4 (0.4, 12.4) 0.0357 BACTROBAN® vs. saline 2.0 (-4.0, 8.0) 0.5030 Average AUEC (AUEC/15) Prototype vs. BACTROBAN® 8.9 (4.3, 13.4) 0.0002 Prototype vs. saline 9.4 (4.9, 14.0) 0.0001 BACTROBAN® vs. saline 0.6 (-4.0, 5.1) 0.8006 a From mixed effect ANOVA analysis with treatment and site as fi xed effects and subject as random effect. Difference is the fi rst named treatment minus second named treatment such that a positive difference favors the fi rst named treatment.
Purchased for the exclusive use of nofirst nolast (unknown)
From: SCC Media Library & Resource Center (library.scconline.org)