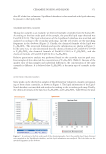
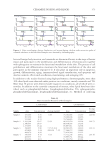
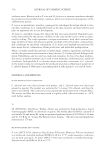
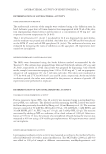
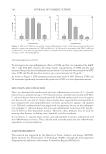
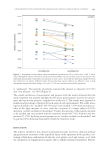
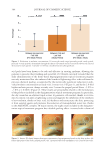
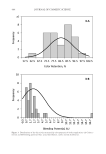
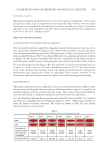
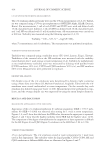
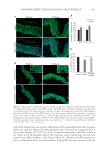
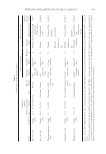
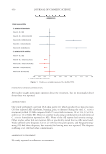
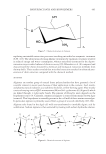
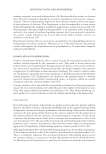
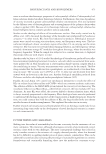
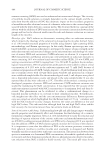
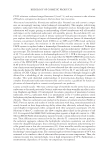
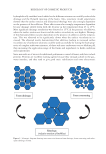
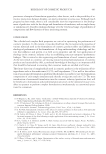
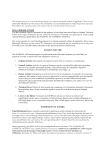
JOURNAL OF COSMETIC SCIENCE 404 Figure 3. Distributions of the objectively measured lip color properties 8 h after application. (A) Color re- tention and (B) bleeding potential. Bars: actual distribution curves: normal distribution.

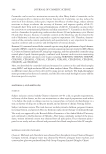
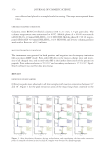
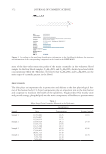
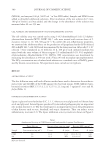
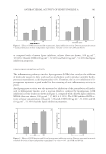
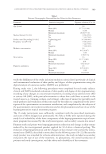
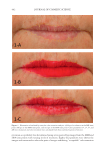
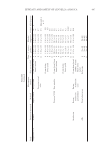
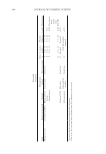
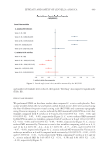
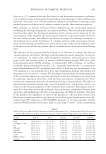
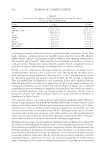
COLOR RETENTION AND BLEEDING POTENTIAL OF A LIPSTICK 405 STATISTICA L ANALYSIS Binomial p robability method was used to test the statistical signifi cance of the panel perception results. Linear interpolation for threshold value between two measured datapoints was performed by determining the lowest possible percentage of panelists who perceived a color parameter acceptable while maintaining the statistical signifi cance (p 0.05 at the 95% confi dence level). RESULTS AN D DISCUSSION QUANTIFICA TION OF COLOR RETENTION AND BLEEDING Our automa ted lip detection algorithms adequately detected the lip area from the clinical im- ages, such as those illustrated in Figures 1 and 2, which made it possible to measure color reten- tion and determine bleeding potential 8 h after application. A mean color retention of 82.67% with a standard deviation of 8.27% was obtained from the test population in this study, as shown in Figure 3A. The observed variability was believed to come from the life habits of partici- pants who paid variable attention to keeping the color on their lips in their daily activities. For color bleeding potential (Figure 3B), the results fell in a linear scale ranging from zero to about 17, with a mean of 2.43 and a standard deviation of 2.97. It was noticed that most of the volunteers did not show much color bleeding around the lips, although the phenomenon was signifi cantly visible on individuals with excessive wrinkles in the mouth area, skewing the data toward the higher end of the bleeding potential range. PANEL PERC EPTION The result s of panel-perceived acceptability on lip color retention are shown in Table I, where the percentages of the panel who perceived pairs of before and after images as “acceptable” are displayed together with the corresponding lip images. The p values of binomial probability tests were also shown to validate the perception results with statistical signifi cance. For color bleeding, although the perception survey asked for unacceptability, we converted the results to acceptability, that is, %Panel (acceptable) = 100%-%Panel (unacceptable), to make the format of analysis consistent. The results are shown in Table II in the fashion similar to those of color retention. Table I Peception Results on Acceptability of Lip Color Retention Levels
Purchased for the exclusive use of nofirst nolast (unknown)
From: SCC Media Library & Resource Center (library.scconline.org)