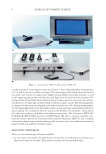
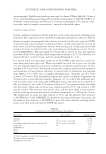
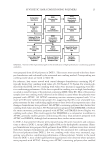
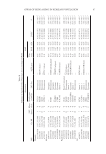
JOURNAL OF COSMETIC SCIENCE 36 Material). Clean and dry air at a fi xed fl ow rate of 2.7 L min-1 was introduced in the cham- ber using an MPB1200 rotameter from MPB Industries (Kent, United Kingdom), cali- brated by a high-volume bubble fl owmeter. Clean air was spiked with HAPs by using an isocratic LC pump HP 1,050 series from Hewlett-Packard (Palo Alto, CA) adjusted to 5 μL min-1 and a glass T connector (see Figure SM2 of Supplementary Material). Air homo- geneity inside the chamber is obtained with two fans with vibration-dampening rubber corners. Infi nite dose conditions were maintained during all the experiments. The simu- lation chamber was placed in a-50 m3 closed room, with controlled temperature (25 ± 1°C) and a fume hood system. DETERMINATION OF HAPS IN THE SIMULATION CHAM BER BY ACTIVE SAMPLING HAP concentration inside the chamber was mea sured by active sampling using a low- volume personal air sampling TUFF Standard from Casella measurements (Bedford, United Kingdom), operating with a low-fl ow adaptor at a fl ow rate of 76 mL min-1 for 30 s. Glass thermal desorber (TD) tubes, capped with perfl uoroalkoxy-polytetrafl uoroeth- ylene (PFA-PTFE) ferrules, were obtained from Perkin Elmer (Waltham, MA) and fi lled with 150 mg of Tenax TA (35–60 mesh) provided by Alltech (Selmsdorf, Germany). Tenax was conditioned before sampling at 300°C during 2 h. All Tenax tubes were analyzed before sampling to demonstrate the usefulness of the conditioning procedure. Active sampling pump fl ow was regulated using an ADM calibrated fl owmeter (Agilent Technologies, Palo Alto, CA) before each sampling. After sampling, tubes were capped with PFA-PTFE ferrules and stored at -10°C until analysis. TD tubes were ther- mally desorbed using a Turbo Matrix series TD from Perkin Elmer coupled to a Trace GC-Polaris Q gas chromatography–mass spectrometry (GC-MS) detector from Finnigan (Waltham, MA), equipped with an Agilent HP-5MS capillary column (30 m, 0.25 mm, and 0.25 μm). Thermal desorption was carried out at 260°C for 20 min using a 75 mL min-1 helium fl ow rate, and desorbed analytes were transferred to a Tenax cold trap at -10°C. A quick trap desorption was carried out at 270°C at 99°C s-1, and the analytes were desorbed and directly transferred to the chromatographic column using a transfer line temperature at 275°C, using a split fl ow of 1:15. The used chromatographic conditions started at an initial temperature of 40°C, held for 8 min, increased at a rate of 20°C min-1 up to 200°C, and fi nally held for 2 min. Acquisition were performed in full scan mode using a mass range from 50 to 150 m/z. A calibration curve was prepared by the direct addition of 10 μL H AP standards in ace- tone directly inside Tenax packed TD tubes. Curve was prepared at fi ve concentration levels ranging from 0.005 to 1.0 μg target analytes. Then, 10 μL toluene-d8 standard solution in acetone at a concentration of 0.01 g L-1 was added inside the Tenax tube to obtain a fi nal mass of 0.1 μg, as internal standard. ABSORPTION STUDIES IN THE SIMULATION CHAMBER In vitro dermal absorption studies were performed using modifi ed vertica l diffusion cells, following the Franz method (10,11). In this study, the donor compartment was

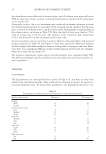
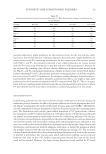
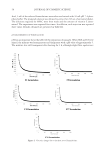
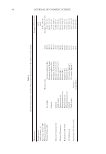
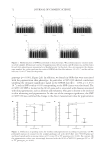
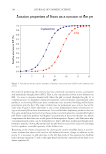
ANTIPOLLUTION COSMETIC EFFECTIVITY AGAINST AIR POLLUTANT ABSORPTION 37 the inside atmosphere of the simulation chamber, and the receiver solution consisted of 12 mL saline solution of 0.9% (w/v) NaCl adjusted to pH 7.4 with phosphate buffer 0.15 M, both maintained at 25°C by control of the external temperature. Receptor solutions in each cell were continuously stirred using a tefl on-coated magnetic stirrer. The synthetic membrane used in this experiment was Strat-M®, specifi cally designed to mimic different layers of human skin and composed of two layers of porous polyether sulfone, on a polyolefi n nonwoven fabric support, treated with synthetic lipids (12). Control experiments were performed with the Strat-M® membrane directly exposed to the surrounding contaminated atmosphere. On the other hand, effectiveness of the antipollution cosmetics was evaluated by homogeneously applying 2 mg product per cm2 exposed membrane, this side of the membrane being in contact to the contami- nated atmosphere. The amount of HAPs diffused through the control and treated membranes was determined by GC-MS analysis of the receptor solution after different exposure times, from 0.5 to 24 h. GC-MS DETERMINATION Analysis of HAPs was performed using direct and head sp ace (HS) injection G C-MS, depending on the physicochemical properties of the analyzed compounds. For HS in- jection, 5 mL acceptor solution with 200 ng mL-1 of internal standard (toluene-d8) was introduced in a 10-mL HS vial, hermetically closed. The vial was heated at 60°C for 20 min and HS measured by GC-MS. In the direct injection method, a liquid–liquid ex- traction of 5 mL acceptor solution with 20 ng mL-1 of internal standard was carried out with 0.5 mL hexane and 2-min vortex shaking. After that, the upper layer was intro- duced in a 2-mL glass vial containing a 200-μL internal volume glass insert and ana- lyzed by GC-MS. The used chromatographic system was an Agilent 7697A HS injector, coupled to a 789 0A GC and a 53975C inert XL EI/CI MSD with a triple-axis single quadrupole detector. An Agilent HP-5MS (30 m, 0.25 mm, and 0.25 μm) capillary column was used, and the oven program of temperatures was an initial temperature of 40°C, held for 8 min, increased at a rate of 20°C min-1 up to 200°C, and fi nally held for 2 min. Injector temperature was 250°C, using helium as carrier gas at a constant fl ow mode of 0.8 mL min-1. Ion source and transfer line temperatures were 300 and 250°C, respec- tively. Electron impact ionization was performed at 70 eV and MS acquisitions using selected ion monitoring mode. Table 1 shows m/z ions and retention time of studied compounds. PERMEATION PARAMETER DETERMINATION HAP concentration data of the receptor solution for each diffusion cell experiment were tran sformed to analyte mass/area unit (μg cm-2). Flux (μg cm-2 h-1) was determined for each experimental condition from the initial slope of the plot of cumulative chemical mass/area in the receptor solution over time. Experimental time points before analyte detection in the receptor solution were not used for slope determination. Lag time (h) is estimated as linear extrapolation back to x-axis of the linear trend of the absorption profi le.
Purchased for the exclusive use of nofirst nolast (unknown)
From: SCC Media Library & Resource Center (library.scconline.org)