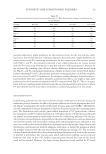
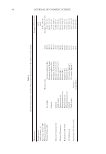
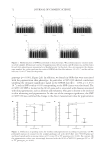
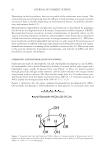
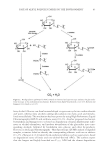
JOURNAL OF COSMETIC SCIENCE 38 Furthermore, pollutant concentration in the simulation chamber air can be estimated through Henry’s law and the concentration of the aqueous receiving solution once the equilibrium was reached, as shown in Equation (2) (13). gas = , Caqueous HCC C (2) where HCC is the dimensionless Henry solubility constant and Caqueous and Cgas are the con centrati ons of analytes in the aqueous and gas phases, respectively. STATISTICAL DATA ANALYSIS HAP absorption parameters were obtained for treated and control experiments as mean ± standard deviat ion of three independent measurements. Student’s t-test was used to de- termine if values obtained for treated and control experiments were statistically different at a P-value lower than 0.05. RESULTS AND DISCUSSION PHYSICOCHEMICAL PROPERTIES OF ANTIPOLLUTION COSMETICS Physicochemical properties of the developed antip ollution cosmetic products, includ- ing viscosity, densi ty, pH, conductivity, and refraction index, have been determined (see Table 2). Viscosity is one of the important physicochemical properties of cosmetics because high viscosity values are associated to a rich composition of active ingredients or consistency factors. On the other hand, low viscosity values could generate problems of dissolution and absorption of the product. As it can be seen in Table 2, antipollution cosmetic B (3.95–4.95) has a higher viscosity value than antipollution cosmetic A (2.53–3.53). Table I Analytical Procedure, Selected Ions, and Retention Time Characteristics of the Analyzed HAPs Analytical procedure Ions (m/z) Retention time (min) Limit of quantifi cation (ng mL-1) 1,2-dichloroethane HS-GC-MS 62 1.54 10 Benzene HS-GC-MS 7,778 1.58 5 Bromodichloromethane HS-GC-MS 83 1.87 10 Toluene HS-GC-MS 9,192 2.36 5 Ethylbenzene GC-MS 91,106 3.69 8 m+p-xylene GC-MS 91, 106 3.99 17 o-xylene GC-MS 91,106 4.65 10 1,2-dibromoethane GC-MS 107 2.63 25 Chlorobenzene GC-MS 112 3.32 91 Bromoform GC-MS 173 4.65 50 Nitrobenzene GC-MS 123 11.00 500 Naphthalene GC-MS 128 12.06 50

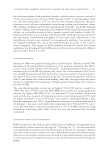
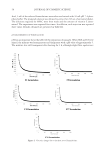
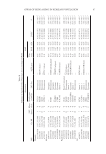
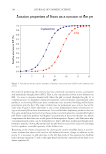
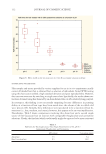
ANTIPOLLUTION COSMETIC EFFECTIVITY AGAINST AIR POLLUTANT ABSORPTION 39 The density of both cosmetic products is similar, presenting values of 1.01–1.03 g cm-3, which is a norm al density value for this type of cream cosmetic product. As cosmetic creams are applied directly on the skin, it is preferable that it possesses a pH similar to tha t of natural skin. Variable skin pH values are being reported in the literature, all in the acidic range but with a broad range from pH 4.0 to 7.0 (14). As it can be seen in Table 2, both cosmetic products have a similar slightly acidic pH value, with values between 6 and 7. The conductivity test is widely used to determine the emulsion type and to estimate emulsion stability. Hig h conductivity values (higher than 50 μS cm-1) indicate oil/water emulsions, whereas low conductivity values ( 1 μS cm-1) indicate water/oil emulsions (15). Conductivity values of cosmetic products are given in Table 2. As it can be seen, product B (1,888–2,832 μS cm-1) has a substantially higher conductivity value than cos- metic A (377–701 μS cm-1), both being oil/water emulsions. Regarding the refraction index, it can be seen that developed cosmetic products show comparable values in the 1.37–1.42 r ange. DESIGN AND EVALUATION OF THE SIMULATION CHAMBER CONDITIONS The air concentration of HAPs inside the chamber is controlled by the concentration and fl ow of the standard solution and the air fl ow. Acetone was selected as carrier solvent be- cause of the solubility of HAP compounds and its high vapor pressure. Moreover, acetone does not enhance the skin absorption of lipophilic compounds, such as HAPs (16). The simulation chamber was preconditioned overnight using the aforementioned working conditions, assuming a zero input–output balance of target analytes after the overnight cycle. Infi nite dose conditions were assured by a constant fl ow of air containing HAPs introduced inside the chamber. Homogeneity of the chamber was assessed during HAP permeability experiments using the aforementioned vertical cell design, at different loca- tions inside the chamber. The results showed a precision, established as relative standard deviation of fi ve measurements (each corner and the center of the chamber) lower than 16% for HAP permeability experiments. Preliminary experiments were carried out at 15 mg m-3 air working concentration ad- justing pure and dry air fl ow to 3.0 L min-1 and 0.9% (w/v) BTEX standard solution (in acetone) fl ow to 5.0 μL min-1. Active sampling was used to evaluate the real concentra- tion of target analytes inside the calibration chamber several times a day, during three consecutive days. Moreover, these concentrations were compared with those obtained af- ter application of Henry’s law taking into consideration the concentration of the analytes Table II Physicochemical Properties of the Developed Antipollution Cosmetic Products Antipollution cosmetic A Antipollution cosmetic B Viscosity (Pa s-1) 2.53–3.53 3.95–4.95 Density (g cm-3) 1.0158–1.0258 1.0136–1.0236 pH 6–7 6–7 Conductivity (μS cm-1) 377–701 1888–2,832 Refraction index (nD) 1.3748–1.3948 1.3999–1.4199
Purchased for the exclusive use of nofirst nolast (unknown)
From: SCC Media Library & Resource Center (library.scconline.org)