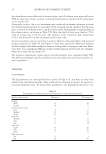
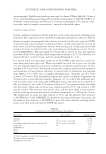
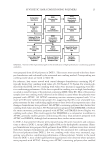
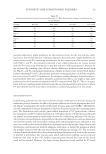
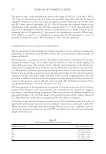
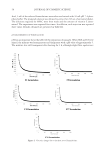
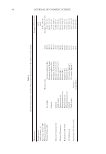
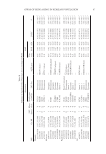
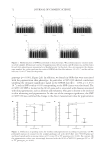
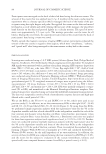
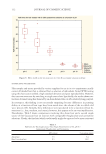
JOURNAL OF COSMETIC SCIENCE 40 in the water solution once the equilibrium was reached. As it can be seen in Table 3, all these values were in the same range as those theoretically expected, with HAP air concen- tration from 12 to 15 mg m-3 and from 8 to 14 mg m-3, except for nitrobenzene that provided 4 and 3 mg m-3, for the active sampling measurement and using Henry’s law, respectively. Thus, the effi ciency of the volatilization system to introduce HAPs inside the simulation chamber was positively assessed. EFFECTIVENESS OF ANTIPOLLUTION COSMETICS Evaluation of the effectiveness of developed antipollution cosmetics has been carried out using the simulation chamber, as previously described. Control experiments were carried out using Strat-M® membranes without any added cosmetic layer, whereas cosmetic sam- ples experiments were performed with Strat-M® membranes with a homogeneous layer of 2 mg product per cm2 exposed membrane. Vertical cell devices for control and cosmetics experiments were introduced in the exposition chamber for different exposition times, from 0.5 to 24 h. After each exposition time, control and cosmetic samples were removed, and receiving solutions were analyzed by GC-MS to evaluate the antipollution effective- ness over time of the evaluated cosmetic. It should be highlighted that for each exposition time, 10 experiments were carried out: one blank, three controls, three cosmetic A– treated experiments, and three cosmetic B–treated experiments. F igure 1 shows permeation curves obtained for the studied HAPs in the control and cosmetic samples A and B. As it can be seen, an initial linear uptake was observed for all compounds that reached the equilibrium at exposition times higher than 12 h, indi- cating that the analyte permeability followed Fick’s fi rst law. The equilibrium state in the case of cosmetic samples is reached at longer times than that in control experiments, Table III Concentration of HAPs in the Simulation Chamber Air Measured by Active Sampling and Using Henry’s Law and Diffusion Parameters HAPs [HAPS] [mg m-3 ± s] KOWa HCCb Permeability at equilibrium (μg cm-2 ± s) J (μg cm-2 h-1 ± s) Active sampling Henry’s law 1,2-dichloroethane 15 ± 3 12 ± 3 1.47 19.83 2.8 ± 0.3 0.566 ± 0.007 Benzene 12 ± 3 9 ± 1 2.13 4.21 0.68 ± 0.07 0.140 ± 0.006 Bromodichloromethane 14 ± 3 11 ± 1 2.10 9.92 1.9 ± 0.2 0.377 ± 0.006 Toluene 12 ± 2 10 ± 1 2.69 3.72 0.67 ± 0.07 0.138 ± 0.008 1,2-dibromoethane 13 ± 3 10 ± 3 1.60 44.62 5.5 ± 0.5 1.2 ± 0.2 Chlorobenzene 14 ± 3 12 ± 3 2.84 7.44 1.6 ± 0.1 0.24 ± 0.04 Ethylbenzene 13 ± 2 10 ± 1 3.13 3.22 0.59 ± 0.06 0.114 ± 0.005 m+p-xylene 25 ± 4 21 ± 2 3.20–3.18 3.47 1.2 ± 0.1 0.25 ± 0.04 Bromoform 13 ± 4 10 ± 4 2.35 42.14 7.4 ± 0.5 1.4 ± 0.3 o-xylene 14 ± 3 14 ± 2 3.13 4.71 1.2 ± 0.1 0.21 ± 0.02 Nitrobenzene 3 ± 1 4 ± 2 1.85 1,140.32 78 ± 13 5.1 ± 0.3 Naphthalene 12 ± 3 8 ± 3 3.36 57.01 7.8 ± 0.8 1.1 ± 0.1 a Kow values obtained from Ref. (22). b Hcc values obtained from Ref. (13).

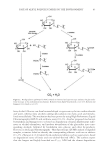
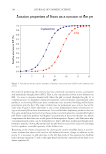
ANTIPOLLUTION COSMETIC EFFECTIVITY AGAINST AIR POLLUTANT ABSORPTION 41 Figure 1. Permeation curves (μg cm-2) obtained for the studied HAPs at 3–15 mg m-3 air concentration in control (black diamond), and cosmetic A (red diamond) and B (white diamond) samples.
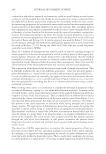
Purchased for the exclusive use of nofirst nolast (unknown)
From: SCC Media Library & Resource Center (library.scconline.org)