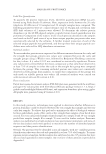
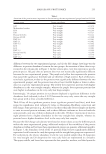
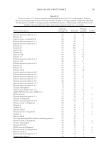
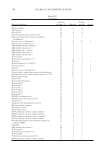
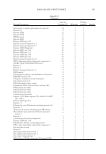
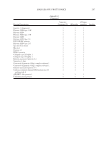
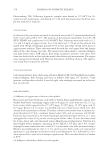
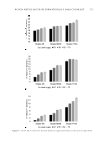
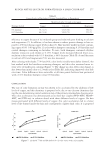
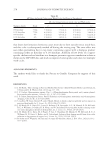
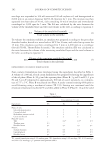
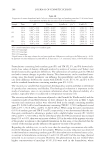
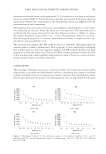
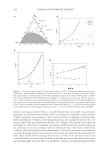
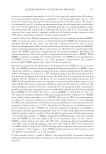
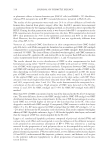
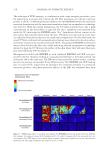
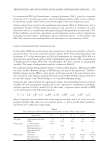
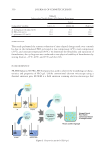
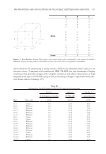
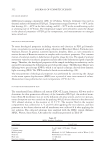
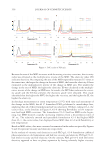
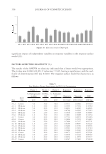
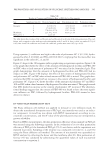
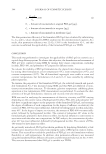
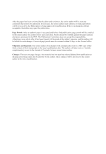
strategy was adopted, whereby each sample consisted of a pool of fi ve individuals. Thus, from the 50 individual samples available from each experimental group, 10 pools were created. Each pool was measured in duplicate to evaluate consistency of the protein profi le within and between pools. Table II List of proteins showing differences in abundance between very curly versus very straight hair samples. The proteins in the list have a signifi cant p value of p 0.05 (which is corrected for multiple testing via Benjamini–Hochberg) and a fold change of at least 2 (log2 fold change = 1) Protein Fold change (very curly/very straight) Adjusted p value Full protein description SBP1 −1.181081415 1.13E-06 Methanethiol oxidase K34 −2.066207146 2.04E-06 Keratin 34 KAP 13-2 1.634917291 9.42E-05 Keratin-associated protein 13-2 KAP 4-4 2.68765369 0.000198 Keratin-associated protein 4-4 KAP 9-8 −1.2927477 0.000288 Keratin-associated protein 9-8 K10 2.010710525 0.000362 Keratin 10 KAP 4-2 −1.112588238 0.000362 Keratin-associated protein 4-2 K38 1.271281473 0.000362 Keratin 38 K1 1.484219137 0.000514 Keratin 1 KAP 4-7 −1.414189772 0.000514 Keratin-associated protein 4-7 K2 1.567179628 0.005741 Keratin 2 ATL3 −2.161080371 0.007585 ADAMTS-like protein 3 K40 −1.129873144 0.028445 Keratin 40 K81 −1.153647498 0.011886 Keratin 81 Figure 3. Abundance levels of the 14 proteins found to be signifi cantly different between the two hair types. The upper, middle, and lower lines represent the fi rst quantiles, medians, and third quantiles of the abundance levels, respectively. HAIR SHAPE PROTEOMICS 257

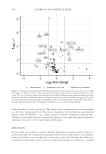
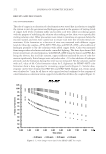
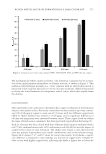
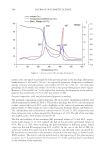
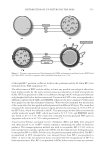
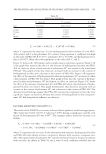
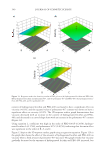
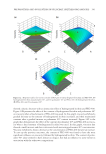
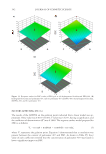
Overall, we identifi ed 362 different proteins across all samples but restricted the statisti- cal comparisons to 217 protein species for which we had confi dent protein identifi cations and that were quantifi ed in at least 75% of the samples. A twofold approach was taken for the analysis of the proteomics data. First, a supervised multivariate clustering method was used to compare overall protein profi les between the different samples. Second, uni- variate analyses were performed to fi nd proteins that had signifi cantly different abundance levels between the two experimental groups. In the supervised multivariate analysis, a clear discrimination of the two experimen- tal groups was observed based on two components (Figure 1). Key observations were as follows: fi rst, many of the duplicates in the pooled samples were in close proximity to each other. This means that the overall protein profi les in these duplicate samples were very similar, which indicates good proteomic profi ling performance. Second, a clear difference between the very straight and the very curly samples was seen when taking into account the overall profi les of the 217 confi dently identifi ed proteins per sample, and this discrimination was mainly based on the fi rst component (x-axis) of the PLS-DA plot, which explains 28% of the variance. Differences in structural proteins are likely to inform us about potential differences in hair performance and those associated with insults and interventions. When looking at the top 20 proteins contributing to the discrimination of the curly versus straight hair shape in the fi rst component (Figure 1, Table I), most can be linked to structural protein components of hair, that is, keratin or KAP families, with keratin K85, the strongest contributor to the distinction of the very straight hair shaft pools, whereas KAP 13-2 has the most discrimination power in the very curly hair pooled samples. Interestingly, K85, one of the fi rst keratins to be expressed during the hair growth process, has been shown to be expressed across the entire developing shaft in straight human hair (20) and in curly Wiltshire wool, but in the latter, its distribution is asymmetric (21). However, no evidence for the link between curly fi bers and KAP 13-2 has previously been reported in the literature. Next, univariate analyses were performed for pairwise comparisons between the two experi- mental groups, which highlighted proteins with different levels of expression between the very straight hair group and the very curly hair group. Interestingly, 14 proteins were identifi ed as signifi cantly differentially expressed (Table II). From these 14 proteins, the majority can be linked to the keratin or KAP families, indicating microstructural com- position differences are important for fi ber shape. The remaining nonstructural proteins are interesting because they may echo differences in processes of fi ber growth and matura- tion (e.g., cornifi cation) between fi bers of different shapes. As hair shafts are known to display marked intra- and between-person variation, we opted to visualize the protein abundance levels of each of the 20 samples measured per experi- mental group to see whether large differences in these abundances could be found across the samples within an experimental group. Interestingly, for many proteins, the detected abundance levels were quite similar within each experimental group, with only minimal differences between the fi rst quantiles, median, and third quantiles in the boxplot, indicat- ing that the sample pooling approach was an effi cient way to minimize variability across samples (Figure 3). The proteins found to have statistically signifi cant fold changes of greater than two are a good starting point for defi ning protein differences between these hair shape sample populations. However, little is known about the functions of most of these proteins in the hair fi ber. JOURNAL OF COSMETIC SCIENCE 258
Purchased for the exclusive use of nofirst nolast (unknown)
From: SCC Media Library & Resource Center (library.scconline.org)