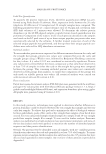
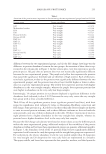
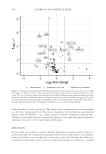
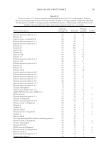
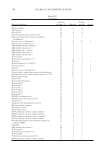
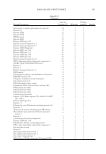
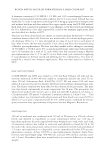
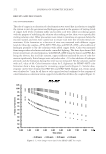
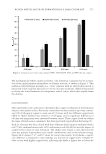
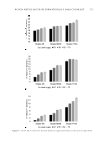
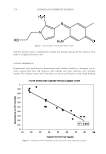
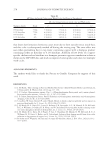
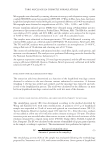
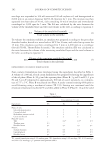
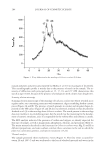
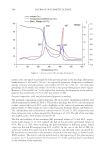
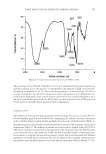
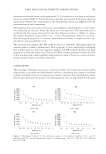
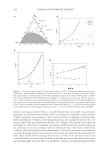
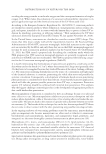
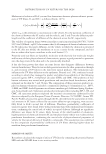
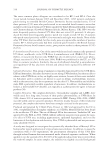
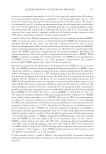
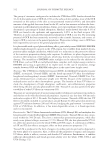
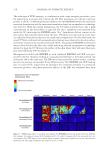
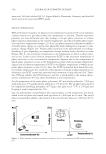
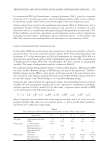
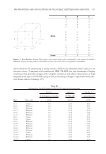
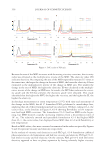
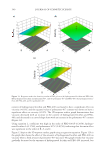
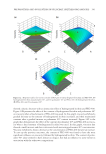
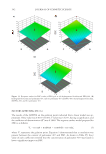
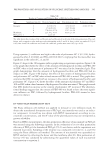
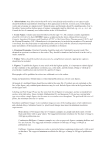
difference between the two experimental groups, and (ii) the fold change: how large was the difference in protein abundance between the two groups. An overview of these data is rep- resented in the volcano plot in Figure 2. In this volcano plot, every dot represents a specifi c protein species. All gray dots are proteins that were not statistically signifi cantly different between the two experimental groups. The purple and yellow dots represent the proteins that passed the signifi cance threshold and are therefore of high interest. Each of these pro- teins had a signifi cant p value (so the proteins were signifi cantly different between the two experimental groups), and the proteins were also at least twofold higher or lower in abun- dance in a specifi c experimental group. The yellow dots represent proteins with higher abundances in the very straight samples, whereas the purple dots represent proteins that were higher in abundance in the very curly hair shape samples. Interestingly, 14 unique pr oteins in our dataset displayed a signifi cant difference in the abundance level (adjusted p-value d 0.05) between the very curly versus the very straight hair group with at least a twofold difference. Table II lists all the s ignifi cant proteins (most signifi cant protein listed fi rst), with their respective signifi cance level (adjusted p value via Benjamini–Hochberg correction) and fold change. Some proteins (e.g., K1) detected in these ethnically diverse samples are known to exist in several protein isoforms, and as these different isoforms are detected with the same peptides, only one of them is displayed in the table. Of these 14 proteins of interest, eight proteins have a higher abundance in the very straight hair samples, whereas six proteins have a higher abundance level in the very curly hair samples. Because the fold-change calculations were based on mean values across the different pools within the same experimental group, additional analysis of the variability of the protein abundances within and between these experimental groups can generate additional insights. In Figure 3, the abundance levels of the 14 proteins found to have signifi cantly different expression levels between the curly hair groups and the straight hair groups are represented. For each protein, the relative abundance levels for every pooled sample (thus 20 datapoints for very straight and 20 datapoints for very curly hair) are represented in a boxplot. The upper, middle, and lower lines represent the fi rst quantiles, medians, and third quantiles Table I Overview of the proteins most important in discriminating the two experimental groups based on PLS-DA Protein group Group contributor Importance K85 Very straight −0.1429 Methanethiol oxidase Very straight −0.1308 K34 Very straight −0.1299 K81 Very straight −0.1127 Protein S100-A3 Very straight −0.1122 Histone H2AX Very straight −0.1098 KAP 9-8 Very straight −0.1083 KAP 2-1 Very straight −0.1082 KAP 4-2 Very straight −0.1062 K38 Very curly 0.1069 K10 Very curly 0.1083 KAP 3-3 Very curly 0.1099 Protein band 4.1 Very curly 0.1169 KAP 4-4 Very curly 0.1170 KAP 13-2 Very curly 0.1192 HAIR SHAPE PROTEOMICS 255

of the abundance levels, respectively. The larger these rectangular boxes in each boxplot are, the more variation between the protein abundance levels within an experimental group is seen. For KAP4-7, e.g., a large variation of protein abundances between indi- viduals was seen within the very curly group, whereas a very tight distribution of protein abundances was seen in the straight hair sample group. DISCUSSION In this study, we sought to explore whether differences could be found at the pro- teome level when we compared two groups of human hair shafts with a very different grade of curliness: very straight hair versus very curly hair. Because hair fi bers are considered to have large intra- and inter-sample phenotypical variabilities, a pooled Figure 2. Volcano plot representing the differential abundancies of proteins in very curly versus very straight hair samples is observed. On the x-axis, the log2 fold change of each protein is represented, whereas on the y-axis, the -log10(p-value) is shown. Proteins that have a high fold change and a signifi cant difference in the abundance level with an adjusted p value are of high interest these proteins are labeled in the graph. The yellow dots on the left represent proteins higher in abundance in the very straight samples, whereas the purple dots on the right represent proteins that were higher in abundance in very curly hair shape samples. JOURNAL OF COSMETIC SCIENCE 256
Purchased for the exclusive use of nofirst nolast (unknown)
From: SCC Media Library & Resource Center (library.scconline.org)