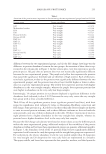
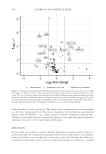
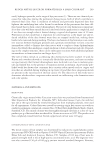
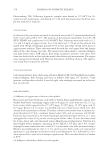
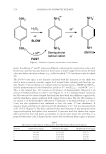
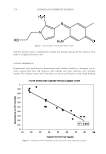
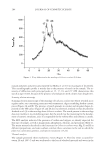
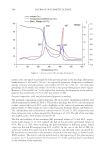
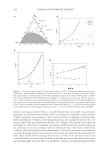
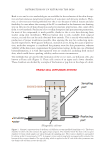
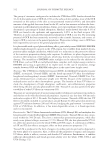
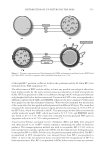
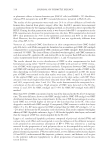
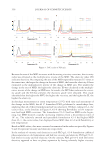
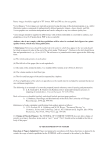
of percolation is considered to be the formation of a bicontinuous phase, whereas in the dynamic percolation model, micelles are formed and ions are exchanged as a result of a “fusion” reaction (4–6). Both models consider t hat percolation occurs when the critical amount of the aqueous phase in the single-phase system ij p w is reached, the so-called percolation threshold. The connecting law between the electrical conductivity and the concentration of the aqueous phase in a single-phase system before and after the percolation threshold ij p w with its critical coeffi cients is shown in the literature (7). In this article, a nanos tructural transition based on the percolation theory of a surfactant- free microemulsion composed of citral, ethanol, and water has been studied by measuring electrical conductivity, DLS, and UV/Vis spectroscopy. EXPERIMENTAL Ethanol (Al drich, p.a.) and citral (Aldrich, p.a.) without prior purifi cation and redistilled water were used to prepare the mixed solvent. Mixed solvents of different mass composi- tions were prepared in glass vials by adding the individual components by weighing. The monophasic region in the ternary phase diagram was determined by adding a specifi c mass of water with a syringe to the initial mass of the mixed solvent of ethanol and citral until the phase separation occurred, thus constructing a binodal curve. Measurements were performed in a thermostatic bath at 298.15 K. A Wayne Kerr device, typ e 6430 A (Wayne Kerr, London, United Kingdom), was used to measure the resistance of working solutions. Its measurement accuracy is 0.02%, the voltage can vary in the range from 0 to 2 V, and the frequency can vary from 20 Hz to 500 kHz. The Anton Paar Litesizer 500 (Anton Paar, Graz, Austria) was used to mea- sure the hydrodynamic radii. Before each measurement, the microemulsion solutions were fi ltered through a 0.2-μm fi lter. Agilent Cary 60 two-beam spectrophotometer (Agilent Cary, Santa Clara, CA) and a 1.0-cm-wide cuvette were used for measurements. RESULTS AND DISCUSSION Fi gure 1A shows the r esults of determining the separation region of the two-phase and single-phase regions, and the binodal curve of the ternary citral–ethanol–water system at 298.15 K. The experimental data are in agreement with those in the literature (8). The plot of κ versus φw at RE/C = 2.3 shown in Figure 1C represents a typical example of percolation phenomena. The conductivity is initially low, indicating the existence of dis- crete inverse micelles in a single-phase system. As the proportion of water in the inverse micelle system increases and when the percolation threshold is reached, there is a sharp increase in electrical conductivity. A sharp increase in electrical conductivity above the percolation threshold and linear growth with a further increase in the water content in the system result in two possible effects: either the formation of microemulsion aggre- gates and charge changes by the fusion reaction between them or the existence of the bi- continuous phase which forms free channels for charge exchange. From the calculation of the experimental data, the obtained result for the critical percolation coeffi cient s is 0.80 for the experimental path RE/C = 2.3 (Figure 1D), indicating the presence of a SURFACTANT-FREE MICROEMULSIONS 293

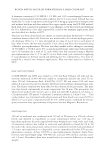
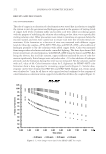
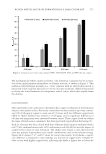
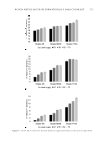
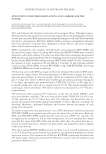
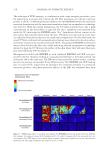
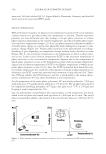
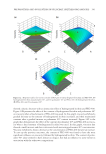
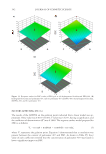
dynamic percolation model. That is, a micelle barrier layer or possible microemulsion aggregates are formed by short-chain alcohol as a surfactant, although a certain amount of water molecules may permeate it due to the interaction of hydrogen bonds between water and ethanol (3). Based on the experimental data, the calculated value for the coef- fi cient p above the percolation threshold is 0.32 (Figure 1D), and as such cannot be attributed to either static or dynamic percolation model because the obtained value for the coeffi cient p is not in accordance with the theoretical value. The main reason for this is that at values above the percolation threshold φwp, due to the intramolecular interaction caused by hydrogen bonds, more and more water molecules penetrate the barrier layer of short chain alcohol with increasing mass fraction of water (3,9). Similar to that in the citronellol system, the short-chain alcohols are not able to form an effective barrier layer of microemulsion-like structure. They can only form a solution containing hydrogen-bonded Figure 1. (A) Ternary phase diagram of citral–ethanol–water at 298.15 K, where the white area represents a single-phase, macroscopically homogeneous system, whereas the gray area represents a two-phase system. The squares refer to selected samples (A-E) of the single-phase ternary citral–ethanol–water system at 298.15 K for measuring DLS. (B) The conductometric mapping of a single-phase ternary citral–ethanol–water sys- tem at 298.15 K refers to the experimental paths shown by the dashed lines in (A). (C) The dependence of electrical conductivity on the mass fraction of added water in a single-phase ternary citral–ethanol–water system at 298.15 K at a constant ratio of the mass fraction of ethanol and citral, RE/C = 2.3. (D) The variation of log κ versus weight fraction of water along the dilution line RE/C = 2.3 above and below the percolation threshold. JOURNAL OF COSMETIC SCIENCE 294
Purchased for the exclusive use of nofirst nolast (unknown)
From: SCC Media Library & Resource Center (library.scconline.org)