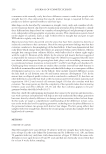
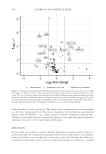
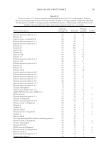
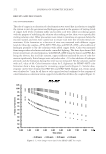
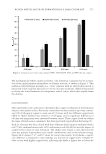
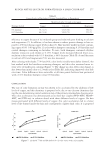
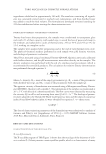
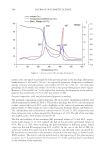
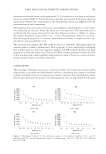
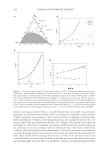
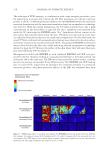
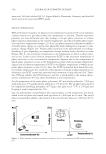
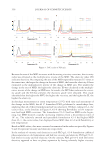
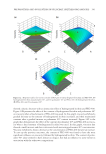
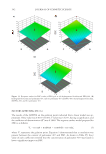
Figure 2. (A) Absorption of aqueous solutions of methyl orange in a ternary mixture of citral–ethanol–water at a constant ratio of mass fractions of ethanol and citral (RE/C = 2.3) and different proportions of added aque- ous solutions of methyl orange (φw), where the concentration of the methyl orange solution is c = 0.1 mmol L-1. (B) Time-dependent self-correlation functions as obtained by DLS for prepared samples (Figure 1A). The size of particles is calculated from well-defi ned correlation functions only. SURFACTANT-FREE MICROEMULSIONS 295

aggregates of water molecules and short-chain alcohols, where molecules of citral are present inside or on edges (3). The microstructure of the envi ronment within the microemulsion aggregates can be de- termined by UV-Vis spectrophotometric measurements using a solvatochromatic probe. By increasing the proportion of aqueous solution of methyl orange in the microemulsion (Figure 2A), the absorption maximum of methyl orange was shifted to the side of higher wavelengths, indicating a higher polarity of the medium. As expected, the absorption maximum of methyl orange increases in the range of 425–431 nm (Figure 2A). The ab- sorption maximum of methyl orange is 465 nm in pure water and 407 nm in ethanol. These results show that the polarity of the dissolved methyl orange environment is be- tween water and ethanol values, and the results are in agreement with those in the litera- ture (3,10–13). Figure 2B) shows that the corr elation becomes increasingly more pronounced the closer the path is to the best percolation path (RE/C = 2.3) obtained from conductometric mea- surement. Then, the calculated hydrodynamic radii from DLS measurements assuming a spherical geometry show the increase in size (for, e.g., sample b hydrodynamic radii are around 9 nm) near the cross section with the best percolation conductivity path. The re- sults agree with the results found in the literature (3,11,14). CONCLUSIONS Classical microemu lsion system s often used the dynamic percolation model. In that case, main explanation is that systems have a weak interfacial fi lm at low water content and below the threshold of appearance of a second regime of conductivity, but this model and the static one cannot fi t the conductivity data of the second regime. The main reason for this is that at values above the percolation threshold, due to the intramolecular interac- tion caused by hydrogen bonds, more and more water molecules penetrate the barrier layer of short-chain alcohol with increasing mass fraction of water. Furthermore, DLS experiments s how that the correlation becomes increasingly more pro- nounced the closer the path is to the best percolation path (RE/C = 2.3). Then, the calcu- lated hydrodynamic radii from DLS measurements assuming a spherical geometry show the increase in size near the cross section with the best percolation conductivity path. The presence of nanostructure may affect the chemical and biological stabilities of fragrance molecules in such hydroalcoholic solutions and could be used as nanodomains for stabili- zation of fragrance molecules, which can refl ect on the vapor pressures of the different components. ACKNOWLEDGEMENT This work was funded by Croatian Science Foundation, project number UIP-2017-05- 6282. REFERENCES (1) G. Smith, C. E. Donelan, an d R. E. J Barden, Oil-continuous microemulsions composed of hexane, water, and 2-propanol, Colloid Interf. Sci., 60(3), 488–496 (1977). JOURNAL OF COSMETIC SCIENCE 296
Purchased for the exclusive use of nofirst nolast (unknown)
From: SCC Media Library & Resource Center (library.scconline.org)