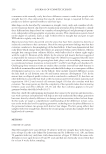
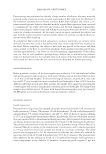
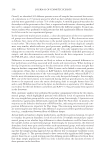
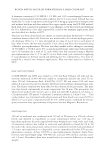
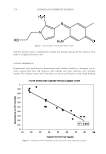
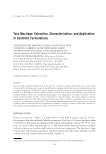
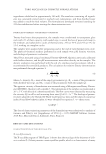
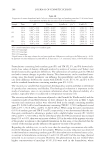
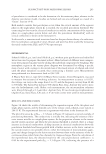
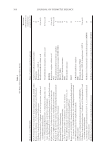
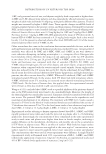
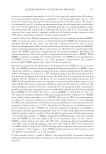
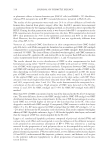
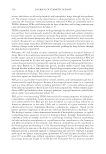
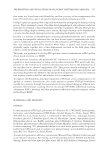
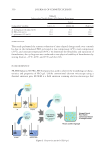
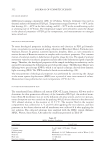
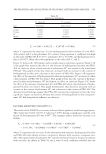
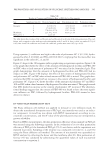
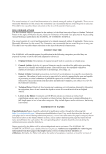
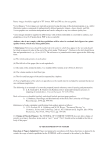
were used. All ethyl alcohol (99.5%, Sigma-Aldrich, Darmstadt, Germany) and distilled water used in the assay were HPLC grade. METHOD OF PREPARATION PLO gel formed is liquid (a sol phase) at low temperatures (around 10°C) and undergoes a phase transition (a gel phase) when the temperature is elevated. Thermo-responsive polymers are macromolecular gels that undergo a sol–gel phase transition or volume phase transition depending on the outside temperature, and this reversible phase transi- tion can detect temperature change (21). A sol–gel phase transition is known to exhibit a reversible phase change as a system that physically forms hydrogels in response to tem- perature change (Figure 1A). Volume phase transition is the phenomenon of swelling– shrinking of gels depending on temperature change without being dissolved in water (Figure 1B). A critical solution temperature is the temperature at which a phase transi- tion occurs. Lower critical solution temperature (LCST) is the minimum temperature of phase transition in the concentration–temperature diagram and is the temperature at which phase separation occurs in the homogeneous phase with increasing temperature. Upper critical solution temperature (UCST) is the highest temperature at which an op- posite phase transition occurs (22,23). Since the UCST system has been limited by rela- tively high temperatures that could affect the properties of drugs or physiologically active substances, the LCST system has attracted much attention in drug delivery (24). There- fore, PLO gel exhibits the LCST behavior, and this is attributable to the unique charac- teristic of poloxamer 407 that shows fl owability at low temperatures. F or the preparation of the water phase, poloxamer 407 was slowly isolated at 1,500 rpm with agitator in 3°C purifi ed water and kept at 3°C for 12 h. The oil phase was prepared by completely dissolving poloxamer 407 using a hot plate set at 75°C at 250 rpm and keeping at room temperature for 12 h. Last , the polyol phase was performed. The aqueous phase at cold temperature was slowly added to the oil phase and stirred with agi-mixer at 1,800 rpm for 10 min. The polyol phase was gradually added to the mixture of the oil and water phases at 1,800 rpm for 10 min. Figure 1. Phase diagram of thermo-responsive polymers: (A) sol–gel transition and (B) volume transition (25). JOURNAL OF COSMETIC SCIENCE 328

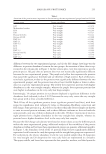
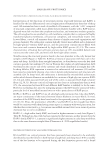
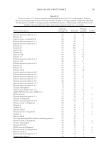
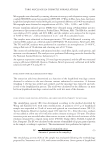
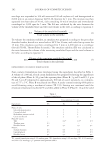
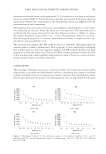
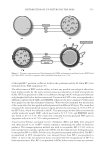
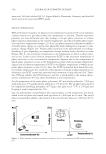
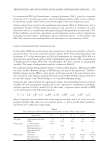
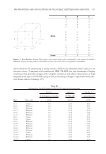
In c onventional PLO gel formulations, isopropyl palmitate (298.5 g/mol) or isopropyl myristate (270.5 g/mol) was used to dissolve hydrogenated lecithin in the oil phase. In the present study, CEH (368.6 g/mol) with higher molecular weight was used. Vari ous polyols were tested in the preliminary experiment (Table I). Polyols are used as moisturizer because of their humectant function, and can serve as cosolvents of active substances and act as cosurfactants through hydrogen bonding with water molecules (25). Polyol candidates used in the experiment are all commonly used as cosmetic ingredients, including butylene glycol, dipropylene glycol, pentylene glycol, 1,2-hexanediol, and PEG-400, and tests were performed for each substance at a concentration of 18%. RANG ES OF THE INDEPENDENT VARIABLES IN RSM In t his study, RSM was used to design the experiments to determine the effects of hydro- genated lecithin, the main constituent of the oil phase PEG-400 of the polyol phase and poloxamer 407 of the water phase on PLO gel formulation by choosing PEG-400 as a representative polyol based on the results of preliminary experiments. The concentrations of hydrogenated lecithin, PEG-400, and poloxamer 407 were selected as independent variables. The range of independent variables is shown in Table II. For experiment design, Design-Expert Version 11 Software (Stat-Ease Inc., Minneapolis, MN) was used, and Box–Behnken design, an RSM design, was used in the experiment. The Box– Behnken design involves IBFact, center points, and factors located at the same distance from the center of the cube. Figure 3 represents the structure of the Box–Behnken design with three factors (26). Figure 3 and Table III depict a 17-run Box–Behnken design. Usin g the data collected from the experiment design, the relationship between response variables (Y) and independent variables (X) can be expressed as a mathematical formula, and this equation is called a model (14). In this study, a response surface model by RSM can be represented as the following equation. 2 2 0 1 2 3 12 13 23 11 22 33 = + + + + + + + + + i Y a a A a B a C a AB a AC a BC a A a B a C2, whe re Yi presents the estimated value of the response variable, and A, B, and C are inde- pendent variables. The value of a0 is a constant, and ai, aii, and aij are the linear, quadratic, and interactive coeffi cients, respectively. Table I Basic Formula for PLO Gel Preparation with Different Three-Phase Compositions Ingredients #1–1 #1–2 #1–3 #1–4 #1–5 Oil phase Hydrogenated lecithin 1.8 1.8 1.8 1.8 1.8 CEH 10.2 10.2 10.2 10.2 10.2 Polyol phase 1,2-Hexanediol 18.0 - - - - Butylene glycol - 18.0 - - - Dipropylene glycol - - 18.0 - - Pentylene glycol - - - 18.0 - PEG-400 - - - - 18.0 Water phase DI-water To 100 To 100 To 100 To 100 To 100 Poloxamer 407 20.0 20.0 20.0 20.0 20.0 Phenoxyethanol 0.3 0.3 0.3 0.3 0.3 PREPARATION AND EVALUATION OF PLURONIC LECITHIN ORGANOGELS 329
Purchased for the exclusive use of nofirst nolast (unknown)
From: SCC Media Library & Resource Center (library.scconline.org)