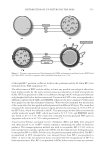
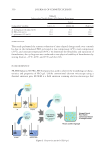
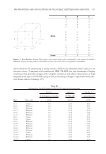
Pre screening was performed to identify a large number of subjects who may meet the required study criteria by review of expert assessments of hair type from the databases of the Unilever Consumer Science Centre, Unilever R&D, Port Sunlight, UK, and of a con- sumer research partner. Subjects identifi ed with the required hair types were then contacted to communicate the study objectives and criteria and the hair sampling requirements subjects meeting the study criteria and willing to participate were then invited to a study center for a further assessment. At the study center, an expert confi rmed the subject hair type met the study recruitment criteria and the absence of any hair or scalp medical con- ditions before fi ber sampling. To sample hair fi bers with minimal exposures to cosmetic treatments, or cosmetic inter- ventions, the hair was cut by a hairdresser very close to the scalp from four locations on the head. Before sampling, the subjects’ hair style was parted in the center and then again, normal to the fi rst, to create four quadrants. Each quadrant was then parted hori- zontally approximately 2 cm above eye level for sampling. Approximately 50 hair fi bers were cut close to each quadrant’s parting along a narrow line to minimize the cosmetic impact of the hair removal. Cut samples from each region of the head were then bundled and secured in a device with the root cut end clearly identifi ed for further processing. SAM PLE PREPARATION Bef ore proteomic analysis, all the hair samples were washed in 1.4% sodium laurel sulfate with gentle agitation and rinsed twice with water. Samples were air-dried and the root-most ~2 cm was cut off and weighed. To minimize biological variation, 20 pools (A–J: very curly hair and K–T: very straight hair) were created with similar weights of hair (±10%) from fi ve different individuals in each pool. After pooling, the samples were snipped to approximately 1-mm lengths and stored in airtight glass containers protected from light. The snipped hair samples were further rinsed 10 times with liquid-chromatography mass spectrometry (LCMS)-grade water and air-dried before mass spectrometric analysis. PROT EOMIC ANALYSIS Samp le preparation Prot eins from 10 mg of each fi ne snipped subsample were extracted with 1 mL of extraction buffer containing 7 M urea, 2 M thiourea, 50 mM dithiothreitol, 50 mM tris(hydroxymethyl) aminomethane, 5% sodium deoxycholate, and pH 7.5. After 18 hours of vigorous shaking at 35°C in an Eppendorf thermomixer (Merck, Kenilworth, NJ), the solubilized proteins were precipitated with a chloroform/methanol procedure. After removal of methanol and air-drying, the protein pellet was resuspended in 100 μL 0.01 M ammonium bicarbonate. The protein concentrations of the hair extracts were quantifi ed using a Direct Detect in- strument (Merck) according to the manufacturer’s instructions, and a volume equivalent to 150 μg of protein from each sample was dried in a vacuum centrifuge. The dried protein was resuspended in 0.1 M ammonium bicarbonate and chemically reduced by agitation with 20 μL of 50 mM dithiothreitol at 56°C for 45 minutes. The proteins were then alkylated by the addition of 20 μL of 150 mM iodoacetamide, with agitation at room temperature in the dark for 30 minutes. Sequencing grade trypsin (3 μg) was HAIR SHAPE PROTEOMICS 251

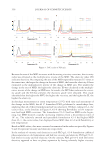
added, and the digestion mixture was incubated overnight at 37°C in the presence of 10% acetonitrile to facilitate enzyme access. The dried digests were resuspended in 50 μL 0.1% formic acid and further diluted 40 times before injection on the mass spectrometer. LC-MS/MS All samples w ere analyzed in triplicate on an Ultimate 3000 UPLC system (Thermo Scientifi c, Waltham, MA) coupled to a maXis Impact HD mass spectrometer via a CaptiveSpray source equipped with a nanoBooster device (Bruker Daltonik, Bremen, Germany). For each sample, 1 μL of the sample was loaded on a C18 PepMap100 nano-Trap column (300 μm ID × 5 mm, 5 micron, 100 Å) (Thermo Scientifi c) at a fl ow rate of 3 μL/min. The trap column was then switched in line with the analytical ProntoSIL C18AQ column (100 μm ID × 150 mm, 3 micron, 200 Å). The reverse phase elution gradient was from 2% to 20% to 45% B over 60 minutes, totaling 84 minutes at a fl ow rate of 600 nL/min. Solvent A was LCMS-grade water with 0.1% formic acid solvent B was LCMS-grade acetonitrile with 0.1% formic acid. To profi le quantitative protein expression patterns, the LC-MS analysis of the samples was performed in positive ion mode, with a mass range between 130 and 2,200 m/z and a sampling rate of 2 Hz. To link the expression levels with identifi cations, a pool of all curly and a pool of all straight samples was created, and triplicate LC-MS/MS runs of these pools were performed using data-dependent acquisition with the following settings: the same LC parameters as described before, a full scan MS spectrum, with a mass range of 50–2,500 m/z, was followed by a maximum of 10 collision-induced dissociation tandem mass spectra (350–1,500 m/z) at a sampling rate of 2 Hz for MS scans and 1–20 Hz for MS/MS (depending on precursor intensity). Precursors with charges 2+ and 3+ were preferred for further fragmentation, and a dynamic exclusion of 60 seconds was set. Following the LC-MS run , the Q-TOF data were analyzed with Compass DataAnalysis 4.4 software (Bruker Daltonics) to evaluate the LC chromatogram and the overall quality of both MS and MS/MS spectra. From each triplicate sample run, the two LC-MS runs of highest quality were chosen to be included in the quantitative analysis. Protein Identifi cation The Peaks X Studio soft ware package (Bio informatic Solutions Inc., Waterloo, ON, Canada) was used to analyze the LC-MS/MS data. The raw data were refi ned by a built-in algorithm, including only ions with a charge 2+ to 5+ and allowing chimeric spectra. The proteins and peptides were identifi ed with the following parameters: a precursor mass error tolerance of 10 ppm and fragment mass error tolerance of 0.05 Da were allowed, the UniProt human database (v2018.07 173,324 sequences) was used, semi-trypsin was specifi ed as digestive enzyme, and up to two missed cleavages were allowed. Carbamidomethylation of cysteine was set as a fi xed modifi cation. Oxidation (M) and deamidation (NQ) were chosen as vari- able modifi cations for the Peaks DB search, and in the optimized Peaks posttranslational modifi cation (PTM) search, pyro-Glu from Q and carbamylation (C) were added to the variable modifi cation list. A maximum of three PTMs per sample were permitted. False discovery rate (FDR) estimation was made based on decoy fusion. An FDR of 1% at the peptide-spectrum match level (associated with a peptide score threshold of -10 log p 22) and a peptide PTM A-score of 50 and a protein -10lgP score 20 were considered adequate for confi dent peptide and protein identifi cation. At least one unique peptide per protein is required for both identifi cation and quantifi cation purposes. JOURNAL OF COSMETIC SCIENCE 252
Purchased for the exclusive use of nofirst nolast (unknown)
From: SCC Media Library & Resource Center (library.scconline.org)