Label-Free Quantifi cation To quantify the protein e xpression levels, label-free quantifi cation (LFQ) was per- formed using Peaks Studio X software. Here, expression levels between the 20 curly (duplicate LC-MS runs of 10 samples) and 20 straight samples were compared. The following parameters were set: a mass tolerance error of 10 ppm and a retention time (RT) shift tolerance of 2 minutes were allowed. To determine the relative protein abundances in the LC RT-aligned samples, peptide feature–based quantifi cation was performed. Comparison of the relative levels of each protein identifi ed in the samples was based on the LC peak areas of up to three unique peptides per protein that were automatically selected by the software. A further manual inspection of each of the selected unique peptides was performed, and the top three best unique peptide can- didates were selected for LFQ abundance estimations. Statistical analysis To a ssess whether protein s were expressed in different amounts between the curly and the straight hair groups, protein area values were compared between the curly and straight groups using a Welch t-test, followed by Benjamini–Hochberg correction for the p values. A p value d 0.05 was considered as statistically signifi cant. Protein area values were screened before the means comparison so that only those observed in at least 75% of samples in either the curly or the straight hair group were compared between the groups. This screening excluded protein area values not consistently observed in both groups from analysis, to ensure that comparison of the groups was only made on reliable protein area values. All statistical analyses were carried out with statistical software R (version 4.0.0). Data visualization Partial least square-discri minant analysis (PLS-DA) plots were generated with the mixOmics package (19), volcano plots with the EnhancedVolcano package (version 1.7.2, https:// github.com/kevinblighe/EnhancedVolcano), and expression abundance plots using ggplot. All graphs were generated using R (version 4.0.0). RESULTS In this study, prot eomic te chnologies were applied to determine whether differences in protein abundance could be observed between the very straight hair samples and the very curly hair samples. To achieve this goal and to minimize the effect of biological variance between individuals, pools of fi ve curly or fi ve straight hair samples of our batch were created. Ten very curly pooled samples (named sample A to sample J) and 10 very straight pooled hair samples (sample K to sample T) were used for further analysis. Proteomic analysis was performed on a high-resolution mass spectrometer instrument, and state-of- the-art data analysis tools were applied, to maximize the number of identifi ed peptide sequences and thus protein identifi cations. Overall, 362 proteins were be identifi ed across all samples, with 217 confi dent protein identifi cations that were detected and quantifi ed in at least 75% of all samples. To ensure rigorous statistical analysis, further analysis was only based on the 217 proteins that were detected and quantifi ed in most samples. An overview of these proteins is provided in Appendix 1. HAIR SHAPE PROTEOMICS 253

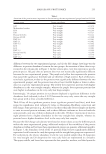
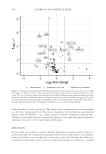
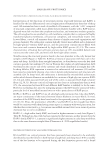
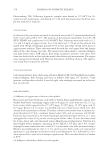
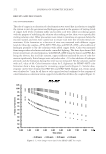
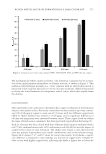
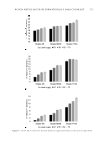
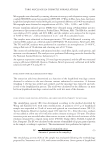
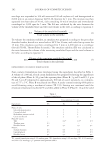
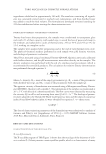
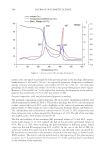
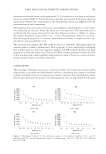
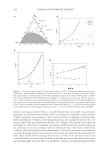
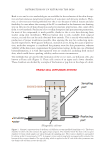
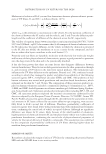
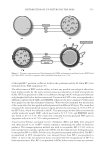
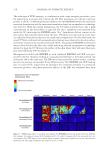
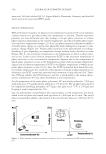
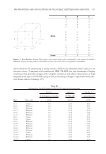
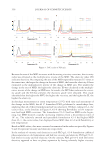
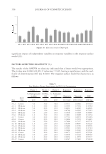
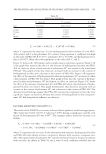
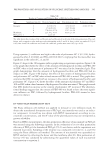
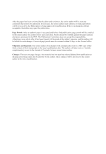
DIFFERENCES IN PROTEIN PROF ILES To investigate differences in protein profi les between samples, a multivariate data analysis approach was performed using a supervised partial least squares-discriminant analysis (PLS- DA). When comparing the protein profi les of the 217 quantifi ed proteins in each pool, the pooled samples belonging to the very curly hair group or the very straight hair group were able to be distinguished based on the protein abundance profi les of the proteins (Figure 1). To better understand which proteins were the key contributors in the discrimination between these two groups in the PLS-DA, the top 20 proteins that contributed the most to this discrimination in the fi rst component were determined. An overview of the protein groups they belong to is listed in Table I. Keratin 85 was the strongest contributor to the distinction of the very straight hair shaft pools, whereas KAP 13-2 had the most dis- crimination power in the very curly hair pooled samples. DIFFERENCES IN PROTEIN ABUN DANCE Next, a univariate analysis was performed to detect proteins whose abundance differed according to the level of curliness. Two different parameters in this statistical analysis are of major importance: (i) the p value: how signifi cantly different was the protein abundance Figure 1. Multivariate analysis via PLS-DA enables clustering of the 20 pooled samples measured in duplicate (A1 to T2) based on the protein abundance levels of 217 proteins present in the samples. A clear discrimination between the very curly hair group and the very straight hair group is seen. JOURNAL OF COSMETIC SCIENCE 254
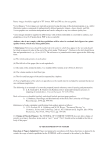
Purchased for the exclusive use of nofirst nolast (unknown)
From: SCC Media Library & Resource Center (library.scconline.org)