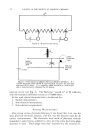
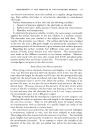
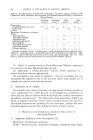
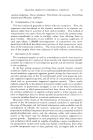
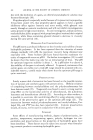
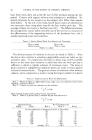
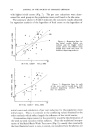
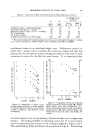
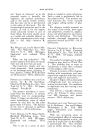
DEGERMING ACTIVITY OF TOILET BARS 415 TAm,E 5--CoMvARISO• or DIFFERENT METHODS OF CALCULATION OF PER CENT REDUCTION IN SEP. IAL BASIN WASH TEST Poor Degerming Product Hand Bacterial Counts* Per Cent Initials Finals Basis of Calculation Reduction$ 3569 1059 3119 2174 1889 280 1150 376 1031 514 655 1638 370 955 292 1051 133 219 Arithmetic mean Logarithmic mean Initial count assumed 1540 Only initial counts over 1000 Only initial counts within one Std. Dev. 8 (--42 to 58) 17 (--50 to 65) 53 (12 to 75) 65 (28 to 83) 1 (--36 to 38) * 000 omitted. t Average of fourth basin counts on two successive days. :l: Values in parentheses are 95% confidence limits. sons of the several methods of calculating per cent reductions from typical Serial Basin Wash Tests are shown for a good germicidal bar (Table 4) and for a poor germicidal bar (Table 5). It is apparent that no ambiguity exists in the case of the better product. On the other hand, one may reject or accept the mediocre (or poor) product depending on the way the data are handled. It is reasoned that the results obtained from individuals with low initial counts are as meaningful as those from subjects having high initial counts. Initial counts for individuals participating in many tests show a coefficient of variation of 25 to 50 per cent. In these cases the results of a test can be predicted to a large extent. Knowing the mean level of cutaneous bacteria for an individual, it is very probable that a substantial reduction in count will occur when the ini- tial count for that particular test is much higher than the individual's mean count, even with a mediocre product. Conversely, a large reversal is ex- pected for the same product when the initial count is at the extreme low end of the range. It has been found, however, that the most effective de- germing products never allow reversals in low initial count subjects, while mediocre to poor deodorant bars give rise to a severalfold increase in hand bacterial counts in similar individuals. Thus, low initial counts are just as useful as high or mean initial counts in assessing degerming activity. The question that remains then, is how best to handle random initial counts to give reproducible results whether these counts are all low, all high, or over a large range. Allowing for the normal variation within individuals, an ineffective prod- uct will result in no change in cutaneous counts. Plotting the initial count versus the final count on log-log paper for such a test gives a regres- sion line with a slope of unity. Figure 2 shows the scatter diagram for

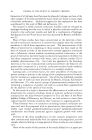
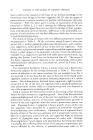
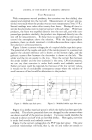
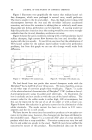
416 JOURNAL OF THE SOCIETY OF COSMETIC CHEMISTS pooled data from many tests using a plain toilet soap as the test bar, illus- trating both the variability of the data and the linear regression with slope of one. The use of a highly effective degerming preparation will produce lower final counts in all individuals giving a line lower than the base line oo o o I l0 INITIAL COUNT- MILLIONS Figure 2.---Correlation ooehand bacterial counts taken two weeks apart with plain soap background. Initial count refers to average of fourth basin counts taken on two successive days. (Fig. 3). The data illustrated in Fig. 3 are from three separate tests on the same deodorant bar. The majority of points are well below the area and the line (broken) of no reduction, indicating a substantial reduction in cu- taneous counts and an effective degerming agent. The regression lines cal- / / / o o [] / ß //• ß [] / ß I IO INITIAL COUNT- MILLIONS Figure &--Regression lines for three separate tests on the same deodorant bar. Broken line repre- sents line of no reduction in hand bacterial counts obtained with plain soap. culated for each test intersect in the region of the population mean of' ini- tial counts. A less effective degerming preparation will lower the higher initial counts and have a lesser or reversing effect on the lower initial counts (Figs. 4-7).
Purchased for the exclusive use of nofirst nolast (unknown)
From: SCC Media Library & Resource Center (library.scconline.org)