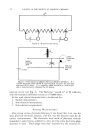
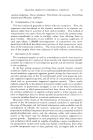
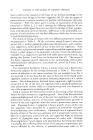
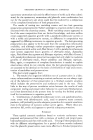
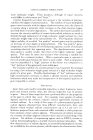
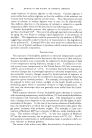
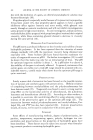
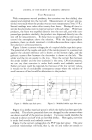
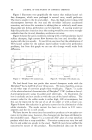
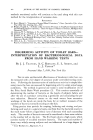
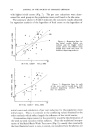
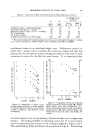
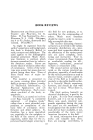
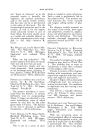
DEGERMING ACTIVITY OF TOILET BARS 417 The re'suits of the first test on a mediocre product are plotted in Fig. 4. Since the per cent reduction for this product ranged from 12 to 62 depending on the method of calculation, the test was repeated wth different subjects. The data from the second test are shown in Fig. 5, with calculated per cent Figure 4.--Results of first test with mediocre degerrning product. Broken line--no reduction. Figure 5.--Results of second test with mediocre degerming product. Broken line--no reduction. / /0 /0 ß / / / / / ß / ß / ß ß 0 / / / ß ß / ß ß / / I I INITIAL COUNT- MILLIONS reductions of 47 to 63. Regression lines were calculated (Fig. 6) for each test and for the combined data. Again, it was found that all three regression lines intersected in the region of the population mean of initial counts. Since approximately half of the initial counts of the pooled data were below one million, the usefulness of these low counts in assessing the effectiveness of a deodorant bar was investigated. Regression lines were calculated for the individuals with low initial counts (below one million) and for those

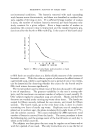
418 JOURNAL OF THE SOCIETY OF COSMETIC CHEMISTS with higher initial counts (Fig. 7). The per cent reductions were deter- mined for each group at the population mean and found to be the same. The summary shown in Table 6 indicates the consistent results obtained by regression analysis of the logarithm of final count on the logarithm of z o I i i i i i t[ i i i i I 10 INITI^L COUNT MILLIONS Figure 6.--Regression lines for low initial counts (below one million) and for higher initial counts (above one million) using pooled data from two tests on mediocre degerming products. z z o u I I o o o ß I ß 0 0 0 øi o ' o ol ø o i o ,, i i i i i i i i I i i i I i I I IO INITI^/ COUNT- MILl_IONS Figure 7.--Regression lines tbr each of two tests and for pooled data, with mediocre degerming product. Broken line--no reduction. initial count and calculation of per cent reduction for the population mean initial count. This is in contrast to the conflicting values obtained by the other methods which reflect largely the influence of low initial counts. A tremendous improvement in the sensitivity would be the elimination of the week to week variation within subjects. Since the traditional interpre- tation of the Serial Basin Wash Test curve (Fig. 1), namely that eventually the hand bacterial count is zero, is unreal, we wondered how the plateau (or
Purchased for the exclusive use of nofirst nolast (unknown)
From: SCC Media Library & Resource Center (library.scconline.org)