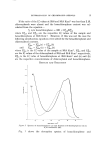
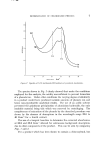
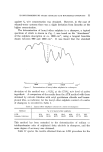
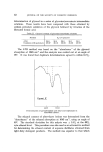
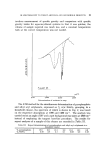
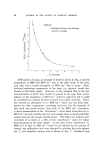
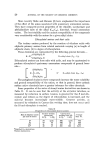
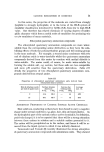
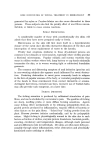
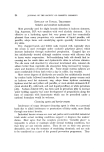
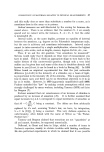
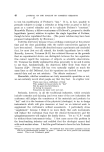
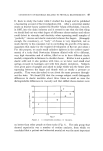
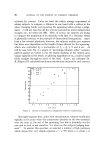
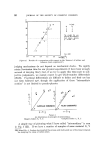
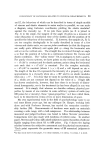
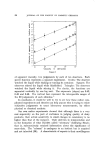
14 JOURNAL OF THE SOCIETY OF COSMETIC CHEMISTS ATR spectra of soaps, an example of which is shown in Fig. 3, showed absorptions at 2800 and 2910 cm -• due to the alkyl chain of the fatty acid salts and a broad absorption at 3410 cm -• due to water. Other hydroxyl-containing components in the soap, e.g. glycerol, would also absorb in this latter region. However, it was assumed that at the low concentrations at which they would be present in the soap their contri- butions to the absorption at 3410 cm -• could be neglected and it could be considered as a binary mixture of water and a fatty acid salt. Water also showed an absorption at ca. 1640 cm% which was free from inter- ference by other components containing hydroxyl, but the intensity of this band was much weaker than that of the 3410 cm -• absorption. A direct measurement of the "absorbance" of the water absorption at ca. 3410 cm -• was not possible since for each sample there is non-reproducible contact between the sample and the prism. This effect was found to give variations of as much as + 12% in the "absorbance" values for repeat determinations on the same sample. As the ratio of the "absorbance" at 2800 cm -• to that at 3410 cm -• would not be affected by the amount of contact, the calibration curve was obtained by plotting this ratio against 'the % w/w moisture content and is shown in Fig. 4. Standard soap

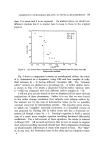
IR SPECTROSCOPY TO TOILET ARTICLES AND HOUSEHOLD PRODUCTS 15 samples were shredded and their moisture contents determined by Dean and Starke distillation with 95/120 ø petroleum ether. Simultaneously, the ATR spectrum of each sample was recorded in triplicate, at an angle of 33 ø, and the ratio of "absorbances" calculated using a tangent base-line drawn between 2500 and 4000 cm -x. In Table IV are recorded the results obtained for several samples of soap. These moisture contents are com- pared with those obtained by loss in weight, at reduced pressure, under an IR heater. By the latter method the results are in fact the percentage volatiles but for these samples they closely approximate to the moisture content. Table IV Moisture content of soap samples, (a) by ATR method (b) by loss in weight at reduced )ressure under an IR heater. % w/w moisture Sample no. (a) (b) 12.4 12.9 13.0 12.5 14.3 13.9 12.8 12.9 12.9 13.2 14.0 14.0 14.0 14.2 13.6 13.7 13.4 13.5 13.5 9.6 9.5 9.7 9.6 14.3 13.8 13.4 13.7 13.7 13.5 9.3 9.7 9.7 9.5 It was found that for the ATR method the standard deviation was 4-0.25% at the 13.0% w/w moisture level. The examples quoted above show the type of components in various products that can be determined directly by the ATR method. It should be pointed out that the component, or components, determined were relatively major ones, being at least 5% w/w concentration. A further point is that these analyses, which required less than 8 min per deter- mination, could be used for the routine control of such products with
Purchased for the exclusive use of nofirst nolast (unknown)
From: SCC Media Library & Resource Center (library.scconline.org)