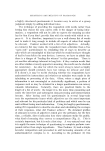
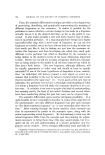
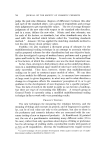
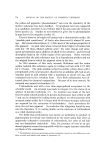
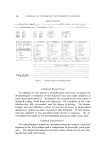
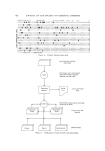
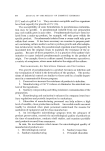
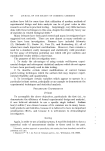
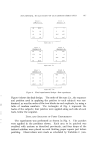
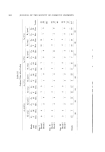
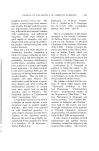
STATISTICAL EVALUATION OF CUTANEOUS IRRITANTS 817 Block' 1 Block 2 (Subject 1) (Subject 2) ad ab c d bc ac cd bd (1) ab c b a abc bcd abd c acd Replicate I Block 3 (Sub,• ect 3) ad ab (1) bc ac cd bd abcd Block 4 (Subject 4) c abc a d bcd abc b acd Replicate II Block 5 (Subject 5) -- (1) ab ac cd ab bc I abcd bd Block 6 (Subject 6) Figure 4. bcd c b abc acd d a abd Replicate III Final experimental design--first experiment Figure 4 shows the final design. The order of the runs (i.e., the sequence and position used in applying the patches to each subject) was ran- domized, as was the order of the two blocks in each replicate, by using a table of random numbers. The rectangles of Fig. 4 represent the backs of the subjects four patches were applied along each side of each back, below the scapulae. DATA AND ANALYSIS OF FIRST EXPERIMENT The experiment was performed as shown in Fig. 4. The patches were applied in the positions shown. Each area to be patched was swabbed with acetone as described previously, and four drops of the irritant solution were placed on each blotting paper square just before patching. Observations were made as scheduled by Variables C (con-

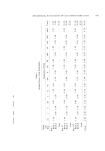
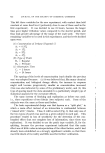
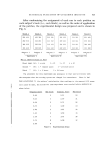
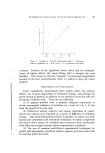
818 JOURNAL OF THE SOCIETY OF COSMETIC CHEMISTS tact time) and D (observation time). All scoring was done by compar- ing a patched area with an adjacent untreated and untaped skin area. All patches not being read were draped to reduce subjectivity. The order of reading the sites on a given subject was not controlled. Table I shows the scores obtained. The scoring system used was that of Fig. 1. A conventional analysis of variance was carrild out on the data of Table I.* Table II summarizes the analysis. Note that the mean square for error was 0.2335. This represents an error standard devia- tion of about 0.48 scoring units, and accounts for all sources of variation not specifically listed in Table II (scoring errors, position effects, patch tightness, etc.). Therefore, the portion of this error attributable to scoring error must have been less than this value unless all other sources of variation were zero. It thus appeared that the reading of patches to the nearest 0.25 unit was a reasonable procedure. It should also be noted that the total blocks mean square was sub- stantial, as expected, suggesting that the separation of this effect (i.e., subject-to-subject differences) from the error by the blocking and con- founding techniques was important. In drawing conclusions from this experiment, it was decided not to ignore any effects showing significance at the 85% confidence level or better, since the only consequences of falsely assuming an effect to be real would be its indusion in further work. There was a strong contact time effect, as expected, but the only interaction involving this was the triple interaction. Since such inter- actions are rare, this was viewed with some skepticism, but it was nevertheless investigated further (see second experiment below). The remaining significant effects were all included in the same triple inter- action, so that the most informative interpretation of the experiment with respect to these effects was done by examining this alone. To do this, averages of all data for each combination of factors, A, B, and D were computed and plotted. The averages and the plots are shown in Fig. 5. As shown in Fig. 5, at 2 hours' observation time, increasing con- centration of the irritant produced a sharp increase in irritation when the pressure patch was used but a decrease when the regular patch was used. After 18 hours, however, although there is a possibility of a slightly * There has been hesitation in the past toward the use of analysis of variance with scored data however, it has been shown that the non-normality of such data does not seriously interfere with the validity of conclusions drawn, and such procedures are now widely used.
Purchased for the exclusive use of nofirst nolast (unknown)
From: SCC Media Library & Resource Center (library.scconline.org)